Proctor and Gamble 2012 Annual Report Download - page 66
Download and view the complete annual report
Please find page 66 of the 2012 Proctor and Gamble annual report below. You can navigate through the pages in the report by either clicking on the pages listed below, or by using the keyword search tool below to find specific information within the annual report.-
 1
1 -
2
-
3
-
4
-
5
-
6
-
7
-
8
-
9
-
10
-
11
-
12
-
13
-
14
-
15
-
16
-
17
-
18
-
19
-
20
-
21
-
22
-
23
-
24
-
25
-
26
-
27
-
28
-
29
-
30
-
31
-
32
-
33
-
34
-
35
-
36
-
37
-
38
-
39
-
40
-
41
-
42
-
43
-
44
-
45
-
46
-
47
-
48
-
49
-
50
-
51
-
52
-
53
-
54
-
55
-
 56
56 -
 57
57 -
 58
58 -
 59
59 -
 60
60 -
 61
61 -
 62
62 -
 63
63 -
 64
64 -
 65
65 -
 66
66 -
 67
67 -
 68
68 -
 69
69 -
 70
70 -
 71
71 -
 72
72 -
 73
73 -
 74
74 -
 75
75 -
 76
76 -
77
-
78
-
79
-
80
-
81
-
82
-
83
-
84
-
85
-
86
-
87
-
88
-
89
-
90
-
91
-
92
 |
 |

64 The Procter & Gamble Company
Amounts in millions of dollars except per share amounts or as otherwise specified.
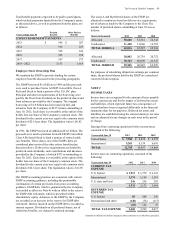
Total stock-based compensation expense for stock option
grants was $317, $358 and $417 for 2012, 2011 and 2010,
respectively. Total compensation cost for restricted stock,
RSUs and PSUs was $60, $56 and $36 in 2012, 2011 and
2010, respectively. The total income tax benefit recognized
in the income statement for stock options, restricted stock,
RSUs and PSUs was $102, $117 and $118 in 2012, 2011 and
2010, respectively.
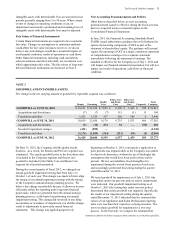
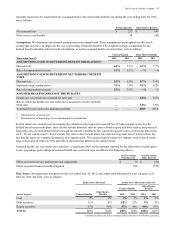
In calculating the compensation expense for stock options
granted, we utilize a binomial lattice-based valuation model.
Assumptions utilized in the model, which are evaluated and
revised, as necessary, to reflect market conditions and
experience, were as follows:
Years ended June 30 2012 2011 2010
Interest rate 0.2-2.1% 0.3-3.7% 0.3-4.0%
Weighted average
interest rate 1.9% 3.4% 3.7%
Dividend yield 2.6% 2.4% 2.2%
Expected volatility 12-18% 14-18% 15-20%
Weighted average
volatility 15% 16% 18%
Expected life in
years 8.5 8.8 8.8
Lattice-based option valuation models incorporate ranges of
assumptions for inputs and those ranges are disclosed in the
preceding table. Expected volatilities are based on a
combination of historical volatility of our stock and implied
volatilities of call options on our stock. We use historical
data to estimate option exercise and employee termination
patterns within the valuation model. The expected life of
options granted is derived from the output of the option
valuation model and represents the average period of time
that options granted are expected to be outstanding. The
interest rate for periods within the contractual life of the
options is based on the U.S. Treasury yield curve in effect at
the time of grant.
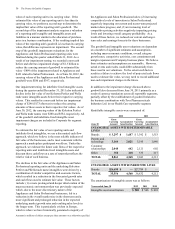
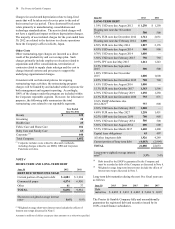
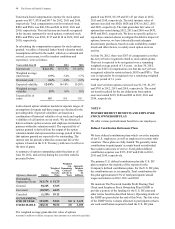
A summary of options outstanding under the plans as of
June 30, 2012, and activity during the year then ended is
presented below:
Options in thousands Options
Weighted
Avg.
Exercise
Price
Weighted
Avg.
Remaining
Contract-
ual Life in
Years
Aggregate
Intrinsic
Valu e
(in
millions)
Outstanding,
beginning of year 363,174 $ 51.75
Granted 30,225 67.05
Exercised (38,967) 44.53
Canceled (1,339) 59.12
OUTSTANDING,
END OF YEAR 353,093 53.83 5.0 $ 3,125
EXERCISABLE 268,131 50.52 3.8 3,109
The weighted average grant-date fair value of options
granted was $8.05, $11.09 and $13.47 per share in 2012,
2011 and 2010, respectively. The total intrinsic value of
options exercised was $820, $628 and $342 in 2012, 2011
and 2010, respectively. The total grant-date fair value of
options that vested during 2012, 2011 and 2010 was $435,
$445 and $563, respectively. We have no specific policy to
repurchase common shares to mitigate the dilutive impact of
options; however, we have historically made adequate
discretionary purchases, based on cash availability, market
trends and other factors, to satisfy stock option exercise
activity.
At June 30, 2012, there was $297 of compensation cost that
has not yet been recognized related to stock option grants.
That cost is expected to be recognized over a remaining
weighted average period of 1.8 years. At June 30, 2012,
there was $125 of compensation cost that has not yet been
recognized related to restricted stock, RSUs and PSUs. That
cost is expected to be recognized over a remaining weighted
average period of 3.1 years.
Cash received from options exercised was $1,735, $1,237
and $703 in 2012, 2011 and 2010, respectively. The actual
tax benefit realized for the tax deductions from option
exercises totaled $239, $188 and $89 in 2012, 2011 and
2010, respectively.
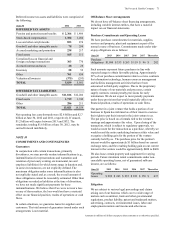
NOTE 8
POSTRETIREMENT BENEFITS AND EMPLOYEE
STOCK OWNERSHIP PLAN
We offer various postretirement benefits to our employees.
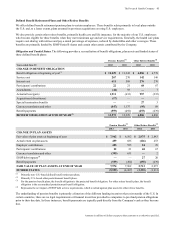
Defined Contribution Retirement Plans
We have defined contribution plans which cover the majority
of our U.S. employees, as well as employees in certain other
countries. These plans are fully funded. We generally make
contributions to participants' accounts based on individual
base salaries and years of service. Total global defined
contribution expense was $353, $347 and $344 in 2012,
2011 and 2010, respectively.
The primary U.S. defined contribution plan (the U.S. DC
plan) comprises the majority of the expense for the
Company's defined contribution plans. For the U.S. DC plan,
the contribution rate is set annually. Total contributions for
this plan approximated 15% of total participants' annual
wages and salaries in 2012, 2011 and 2010.
We maintain The Procter & Gamble Profit Sharing Trust
(Trust) and Employee Stock Ownership Plan (ESOP) to
provide a portion of the funding for the U.S. DC plan and
other retiree benefits (described below). Operating details of
the ESOP are provided at the end of this Note. The fair value
of the ESOP Series A shares allocated to participants reduces
our cash contribution required to fund the U.S. DC plan.