Proctor and Gamble 2012 Annual Report Download - page 65
Download and view the complete annual report
Please find page 65 of the 2012 Proctor and Gamble annual report below. You can navigate through the pages in the report by either clicking on the pages listed below, or by using the keyword search tool below to find specific information within the annual report.-
 1
1 -
2
-
3
-
4
-
5
-
6
-
7
-
8
-
9
-
10
-
11
-
12
-
13
-
14
-
15
-
16
-
17
-
18
-
19
-
20
-
21
-
22
-
23
-
24
-
25
-
26
-
27
-
28
-
29
-
30
-
31
-
32
-
33
-
34
-
35
-
36
-
37
-
38
-
39
-
40
-
41
-
42
-
43
-
44
-
45
-
46
-
47
-
48
-
49
-
50
-
51
-
52
-
53
-
54
-
 55
55 -
 56
56 -
 57
57 -
 58
58 -
 59
59 -
 60
60 -
 61
61 -
 62
62 -
 63
63 -
 64
64 -
 65
65 -
 66
66 -
 67
67 -
 68
68 -
 69
69 -
 70
70 -
 71
71 -
 72
72 -
 73
73 -
 74
74 -
 75
75 -
76
-
77
-
78
-
79
-
80
-
81
-
82
-
83
-
84
-
85
-
86
-
87
-
88
-
89
-
90
-
91
-
92
 |
 |

The Procter & Gamble Company 63
Amounts in millions of dollars except per share amounts or as otherwise specified.
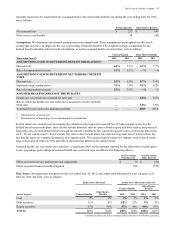
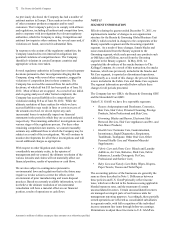
NOTE 6
EARNINGS PER SHARE
Net earnings attributable to Procter & Gamble less preferred dividends (net of related tax benefits) are divided by the weighted
average number of common shares outstanding during the year to calculate basic net earnings per common share. Diluted net
earnings per common share are calculated to give effect to stock options and other stock-based awards (see Note 7) and assume
conversion of preferred stock (see Note 8).
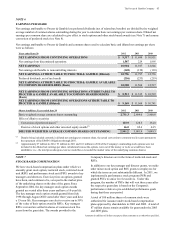
Net earnings attributable to Procter & Gamble and common shares used to calculate basic and diluted net earnings per share
were as follows:
Years ended June 30 2012 2011 2010
NET EARNINGS FROM CONTINUING OPERATIONS $ 9,317 $ 11,698 $ 10,851
Net earnings from discontinued operations 1,587 229 1,995
NET EARNINGS 10,904 11,927 12,846
Net earnings attributable to noncontrolling interests (148)(130)(110)
NET EARNINGS ATTRIBUTABLE TO PROCTER & GAMBLE (Diluted) 10,756 11,797 12,736
Preferred dividends, net of tax benefit (256)(233)(219)
NET EARNINGS ATTRIBUTABLE TO PROCTER & GAMBLE AVAILABLE
TO COMMON SHAREHOLDERS (Basic) 10,500 11,564 12,517
NET EARNINGS FROM CONTINUING OPERATIONS ATTRIBUTABLE TO
PROCTER & GAMBLE AVAILABLE TO COMMON SHAREHOLDERS
(Basic)
$ 8,913 $ 11,335 $ 10,522
NET EARNINGS FROM CONTINUING OPERATIONS ATTRIBUTABLE TO
PROCTER & GAMBLE (Diluted) $ 9,169 $ 11,568 $ 10,741
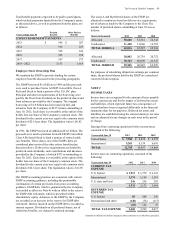
Shares in millions; Years ended June 30 2012 2011 2010
Basic weighted average common shares outstanding 2,751.3 2,804.0 2,900.8
Effect of dilutive securities
Conversion of preferred shares(1) 123.9 128.5 134.0
Exercise of stock options and other unvested equity awards(2) 66.0 69.4 64.5
DILUTED WEIGHTED AVERAGE COMMON SHARES OUTSTANDING 2,941.2 3,001.9 3,099.3
(1) Despite being included currently in diluted net earnings per common share, the actual conversion to common stock occurs pursuant to
the repayment of the ESOPs' obligations through 2035.
(2) Approximately 67 million in 2012, 93 million in 2011 and 101 million in 2010 of the Company's outstanding stock options were not
included in the diluted net earnings per share calculation because the options were out of the money or to do so would have been
antidilutive (i.e., the total proceeds upon exercise would have exceeded the market value of the underlying common shares).
NOTE 7
STOCK-BASED COMPENSATION
We have stock-based compensation plans under which we
annually grant stock option, restricted stock, restricted stock
unit (RSU) and performance stock unit (PSU) awards to key
managers and directors. Exercise prices on options granted
have been, and continue to be, set equal to the market price
of the underlying shares on the date of the grant. Since
September 2002, the key manager stock option awards
granted are vested after three years and have a 10-year life.
The key manager stock option awards granted from July
1998 through August 2002 vested after three years and have
a 15-year life. Key managers can elect to receive up to 50%
of the value of their option award in RSUs. Key manager
RSUs vest and are settled in shares of common stock five
years from the grant date. The awards provided to the
Company's directors are in the form of restricted stock and
RSUs.
In addition to our key manager and director grants, we make
other minor stock option and RSU grants to employees for
which the terms are not substantially different. In 2011, we
implemented a performance stock program (PSP) and
granted PSUs to senior level executives. Under this
program, the number of PSUs that will vest three years after
the respective grant date is based on the Company's
performance relative to pre-established performance goals
during that three year period.
A total of 180 million shares of common stock were
authorized for issuance under stock-based compensation
plans approved by shareholders in 2003 and 2009. A total of
87 million shares remain available for grant under the 2003
and 2009 plans.