Proctor and Gamble 2012 Annual Report Download - page 53
Download and view the complete annual report
Please find page 53 of the 2012 Proctor and Gamble annual report below. You can navigate through the pages in the report by either clicking on the pages listed below, or by using the keyword search tool below to find specific information within the annual report.-
 1
1 -
2
-
3
-
4
-
5
-
6
-
7
-
8
-
9
-
10
-
11
-
12
-
13
-
14
-
15
-
16
-
17
-
18
-
19
-
20
-
21
-
22
-
23
-
24
-
25
-
26
-
27
-
28
-
29
-
30
-
31
-
32
-
33
-
34
-
35
-
36
-
37
-
38
-
39
-
40
-
41
-
42
-
 43
43 -
 44
44 -
 45
45 -
 46
46 -
 47
47 -
 48
48 -
 49
49 -
 50
50 -
 51
51 -
 52
52 -
 53
53 -
 54
54 -
 55
55 -
 56
56 -
 57
57 -
 58
58 -
 59
59 -
 60
60 -
 61
61 -
 62
62 -
 63
63 -
64
-
65
-
66
-
67
-
68
-
69
-
70
-
71
-
72
-
73
-
74
-
75
-
76
-
77
-
78
-
79
-
80
-
81
-
82
-
83
-
84
-
85
-
86
-
87
-
88
-
89
-
90
-
91
-
92
 |
 |

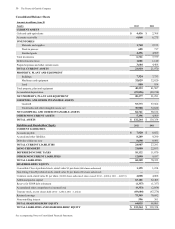
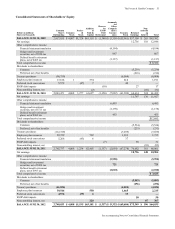
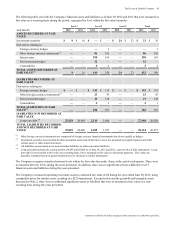
The Procter & Gamble Company 51
See accompanying Notes to Consolidated Financial Statements.
Consolidated Statements of Shareholders' Equity
Dollars in millions/
Shares in thousands
Common
Shares
Outstanding
Common
Stock
Preferr
ed
Stock
Addition
al
Paid-In
Capital
Reserve
for
ESOP
Debt
Retirement
Accumula
ted
Other
Compreh
ensive
Income/
(loss)
Treasury
Stock
Retained
Earnings
Non-
controlli
ng
Interest Total
BALANCE JUNE 30, 2009 2,917,035 $ 4,007 $1,324 $61,118 $ (1,340) $ (3,358) $(55,961) $57,309 $ 283 $63,382
Net earnings 12,736 110 12,846
Other comprehensive income:
Financial statement translation (4,194) (4,194)
Hedges and investment
securities, net of $520 tax 867 867
Defined benefit retirement
plans, net of $465 tax (1,137) (1,137)
Total comprehensive income $ 8,382
Dividends to shareholders:
Common (5,239) (5,239)
Preferred, net of tax benefits (219) (219)
Treasury purchases (96,759) (6,004) (6,004)
Employee plan issuances 17,616 1 574 616 1,191
Preferred stock conversions 5,579 (47) 7 40 —
ESOP debt impacts (10) 27 17
Noncontrolling interest, net (2) (69) (71)
BALANCE JUNE 30, 2010 2,843,471 4,008 1,277 61,697 (1,350) (7,822) (61,309) 64,614 324 61,439
Net earnings 11,797 130 11,927
Other comprehensive income:
Financial statement translation 6,493 6,493
Hedges and investment
securities, net of $711 tax (1,178) (1,178)
Defined benefit retirement
plans, net of $302 tax 453 453
Total comprehensive income $17,695
Dividends to shareholders:
Common (5,534) (5,534)
Preferred, net of tax benefits (233) (233)
Treasury purchases (112,729) (7,039) (7,039)
Employee plan issuances 29,729 702 1,033 1,735
Preferred stock conversions 5,266 (43) 6 37 —
ESOP debt impacts (7) 38 31
Noncontrolling interest, net (93) (93)
BALANCE JUNE 30, 2011 2,765,737 4,008 1,234 62,405 (1,357) (2,054) (67,278) 70,682 361 68,001
Net earnings 10,756 148 10,904
Other comprehensive income:
Financial statement translation (5,990) (5,990)
Hedges and investment
securities, net of $438 tax 721 721
Defined benefit retirement
plans, net of $993 tax (2,010) (2,010)
Total comprehensive income $ 3,625
Dividends to shareholders:
Common (5,883) (5,883)
Preferred, net of tax benefits (256) (256)
Treasury purchases (61,826) (4,024) (4,024)
Employee plan issuances 39,546 550 1,665 2,215
Preferred stock conversions 4,576 (39) 6 33 —
ESOP debt impacts 50 50
Noncontrolling interest, net 220 87 307
BALANCE JUNE 30, 2012 2,748,033 $ 4,008 $1,195 $63,181 $ (1,357) $ (9,333) $(69,604) $75,349 $ 596 $64,035