Proctor and Gamble 2012 Annual Report Download - page 87
Download and view the complete annual report
Please find page 87 of the 2012 Proctor and Gamble annual report below. You can navigate through the pages in the report by either clicking on the pages listed below, or by using the keyword search tool below to find specific information within the annual report.-
 1
1 -
2
-
3
-
4
-
5
-
6
-
7
-
8
-
9
-
10
-
11
-
12
-
13
-
14
-
15
-
16
-
17
-
18
-
19
-
20
-
21
-
22
-
23
-
24
-
25
-
26
-
27
-
28
-
29
-
30
-
31
-
32
-
33
-
34
-
35
-
36
-
37
-
38
-
39
-
40
-
41
-
42
-
43
-
44
-
45
-
46
-
47
-
48
-
49
-
50
-
51
-
52
-
53
-
54
-
55
-
56
-
57
-
58
-
59
-
60
-
61
-
62
-
63
-
64
-
65
-
66
-
67
-
68
-
69
-
70
-
71
-
72
-
73
-
74
-
75
-
76
-
 77
77 -
 78
78 -
 79
79 -
 80
80 -
 81
81 -
 82
82 -
 83
83 -
 84
84 -
 85
85 -
 86
86 -
 87
87 -
 88
88 -
 89
89 -
 90
90 -
 91
91 -
 92
92
 |
 |

The Procter & Gamble Company 85
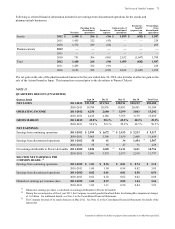
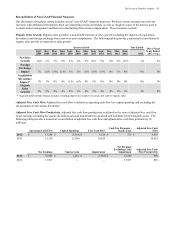
Reconciliation of Non-GAAP Financial Measures
Our discussion of financial results includes several "non-GAAP" financial measures. We believe these measures provide our
investors with additional information about our underlying results and trends, as well as insight to some of the metrics used to
evaluate senior management and factors in determining their at-risk compensation. These measures include:
Organic Sales Growth. Organic sales growth is a non-GAAP measure of sales growth excluding the impacts of acquisitions,
divestitures and foreign exchange from year-over-year comparisons. The following tables provide a numerical reconciliation of
organic sales growth to reported net sales growth:
Quarter Ended Year Ended Three Fiscal
Years Ended
2012 (Avg.)
Sept.
2009
Dec.
2009
Mar.
2010
June
2010
Sept.
2010
Dec.
2010
Mar.
2011
June
2011
Sept.
2011
Dec.
2011
Mar.
2012
June
2012 2012
Net Sales
Growth (6)% 6% 7% 5% 2% 2% 5% 10% 9% 4% 2% (1)% 3% 4%
Foreign
Exchange
Impact 7% (2)% (3)% (1)% 3% 2% (1)% (5)% (5)% 0% 1% 4% 0% 0%
Acquisition/
Divestiture
Impact* 1% 1% 0% 0% (1)% (1)% 0% 0% 0% 0% 0% 0% 0% 0%
Organic
Sales
Growth 2% 5% 4% 4% 4% 3% 4% 5% 4% 4% 3% 3% 3% 4%
* Acquisition/Divestiture Impact includes rounding impacts necessary to reconcile net sales to organic sales.
Adjusted Free Cash Flow. Adjusted free cash flow is defined as operating cash flow less capital spending and excluding the
tax payments for the snacks divestiture.
Adjusted Free Cash Flow Productivity. Adjusted free cash flow productivity is defined as the ratio of adjusted free cash flow
to net earnings excluding the snacks divestiture gain and impairment for goodwill and indefinite lived intangible assets. The
following table provides a numerical reconciliation of adjusted free cash flow and adjusted free cash flow productivity ($
millions):
Operating Cash Flow Capital Spending Free Cash Flow
Cash Tax Payments -
Snacks Gain
Adjusted Free Cash
Flow
2012 $ 13,284 $ (3,964) $ 9,320 $ 519 $ 9,839
2011 13,330 (3,306) 10,024 — 10,024
Net Earnings Snacks Gain Impairment
Net Earnings
Excluding Gain/
Impairment
Adjusted Free Cash
Flow Productivity
2012 $ 10,904 $ 1,418 $ (1,503) $ 10,989 90%
2011 11,927 — — 11,927 84%