RBS 2015 Annual Report Download
Download and view the complete annual report
Please find the complete 2015 RBS annual report below. You can navigate through the pages in the report by either clicking on the pages listed below, or by using the keyword search tool below to find specific information within the annual report.-
 1
1 -
 2
2 -
 3
3 -
 4
4 -
 5
5 -
 6
6 -
 7
7 -
 8
8 -
 9
9 -
 10
10 -
 11
11 -
 12
12 -
13
-
14
-
15
-
16
-
17
-
18
-
19
-
20
-
21
-
22
-
23
-
24
-
25
-
26
-
27
-
28
-
29
-
30
-
31
-
32
-
33
-
34
-
35
-
36
-
37
-
38
-
39
-
40
-
41
-
42
-
43
-
44
-
45
-
46
-
47
-
48
-
49
-
50
-
51
-
52
-
53
-
54
-
55
-
56
-
57
-
58
-
59
-
60
 |
 |

2015 Annual Results and
Update on Strategic Progress
26 February 2016
Table of contents
-
Page 1
2015 Annual Results and Update on Strategic Progress 26 February 2016 -
Page 2
Howard Davies Chairman -
Page 3
Ross McEwan Chief Executive Officer -
Page 4
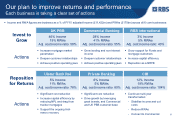
... Accelerated the exit of assets that do not meet our strategy ï,§ Began improving our core businesses to deliver sustainable returns ï,§ Delivered good results against our 2015 targets Delivered a simpler bank and a clearer investment case in 2015 Continue to deal with significant risks/issues Our... -
Page 5
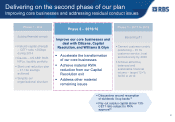
... and addressing residual conduct issues Phase 1 - 2014 Building financial strength Phase 2 - 2015/16 Improve our core businesses and deal with Citizens, Capital Resolution, and Williams & Glyn Phase 3 - 2017 to 2019 Becoming #1 ï,§ Cement customer-centric positioning - #1 for customer service... -
Page 6
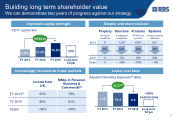
... capital ratio +690bps Simpler and more resilient Property Structure Products # London properties # registered companies # front book products Systems # major banking platforms 2013 11 27% 1,107 34% 733 ~500 416(2) 19% 339 -
Page 7
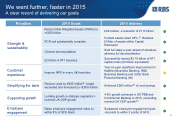
... in NatWest Business Banking, RBS Business Banking and Ulster Bank Personal Banking (NI) Achieved £983 million(8) of cost savings 4.8% growth achieved in UK PBB and Commercial Banking in 2015, exceeding nominal UK GDP growth(9) Surpassed employee engagement goal, +6 points to within 3 points of GFS... -
Page 8
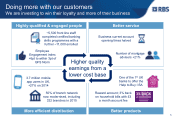
...Employee Engagement index +6pt to within 3pt of GFS Norm Better service Business current account opening times halved Number of mortgage advisers +21% 3.7 million mobile app users in UK, +27% on 2014 Higher quality earnings from a lower cost base One of the 1st UK banks to offer the Help to Buy... -
Page 9
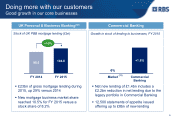
...of UK PBB mortgage lending (£bn) +10% Commercial Banking Growth in stock of lending to businesses, FY 2015 95.5 104.8 0% +1.6% FY 2014 FY 2015 Market (11) Commercial Banking ï,§ £23bn of gross mortgage lending during 2015, up 29% versus 2014 ï,§ New mortgage business market share reached... -
Page 10
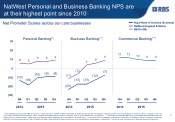
... 2015 2014 2015 7 (*) Personal Banking: Source GfK FRS, 6 month roll. Latest base sizes: NatWest (3509) Royal Bank of Scotland (623) Question "How likely is it that you would to recommend (brand) to a relative, friend or colleague in the next 12 months for current account banking?" Base: Claimed... -
Page 11
...UK PBB Commercial Banking 28% Income 41% RWAs Adj. cost:income ratio: 55% ï,§ Grow lending and non-interest income ï,§ Deepen customer relationships ï,§ Achieve positive operating jaws RBS International 3% Income 5% RWAs Adj. cost:income ratio: 43% ï,§ Grow support for Funds and mortgage customers... -
Page 12
...3 UK Rates, DCM, FX Top 3 European Structured Finance Top 3 Western Europe Investment Grade Corporate DCM Leading market positions(16) #2 UK business bank main relationship #3 ROI Personal Current Accounts Attractive returns and business mix(16) UK and RoI centred bank with focused international... -
Page 13
Delivery goals for 2016 10 -
Page 14
Building core strength Stronger capital position Simpler - costs down Better for customers Growth in core businesses 11 -
Page 15
Ewen Stevenson Chief Financial Officer -
Page 16
... costs Litigation & conduct costs Write-down of Goodwill Operating Expenses Impairment (losses) / releases Operating profit / (loss) Other items Attributable profit / (loss) Key metrics Net interest margin Return on tangible equity Adj. return on tangible equity(17,18) Cost-income ratio Adj... -
Page 17
... expenses(18) Impairment (losses) / releases Adj. operating profit(17,18) Funded Assets Net L&A to Customers Customer Deposits RWAs Adj. RoE (%)(17,18,20) Adj. Cost : Income ratio (%)(17,18) UK PBB RBS Ulster Commercial Private Banking International Bank RoI Banking CIB Total Franchises Capital... -
Page 18
... and funding Loan-to-deposit ratio (%) Liquidity coverage ratio (%) Liquidity portfolio (£bn) Capital & leverage(21) Leverage exposure (£bn) Leverage ratio (%) CET1 capital (£bn) CET1 ratio (%) RWAs (£bn) TNAV TNAV per share (p) Tangible equity (£bn) . FY 2015 Q3 2015 vs.Q3 2015 FY 2014 vs... -
Page 19
FY 2015 - adjusted operating costs (£bn) 11.9 Other reduction (0.4)(22) (1.1) 10.4 Organic reduction (1.0)(23) 9.4 0.4 W&G Capital Resolution Int'l Private Banking (0.8)(24) 8.6 1.5 0.2 1.5 CIB Total Core Bank ex.CIB 5.8 2013 2014(2) 2015 2016 Target 15 -
Page 20
... sheet - resilience CET1 Ratio: 13% Target Leverage Ratio REILs (£bn) (as % of Total Gross L&As) 15.5% +690bps +220bps 3.4% 5.6% 39.4 (9.4%) 8.6% Cap Res 20.3 (69%) 12.2 (3.9%) Ex Cap Res 19.1 3.4 8.8 FY 2013 FY 2015 FY 2013 FY 2015 FY 2013 FY 2015 ï,§ Excluding Capital Resolution... -
Page 21
... 2014 FY 2015 Shipping (£bn)(25) (29%) 10.6 7.5 Emerging Markets (£bn)(26) (61%) 8.7 2.6 4.1 2.0 India China Russia 3.4 1.9 1.1 FY 2015 0.4 FY 2014 FY 2015 FY 2014 17 Note: For further information please see p.198 of the 2015 Annual report and accounts and p.30 of the 2015 Annual Results -
Page 22
... Bank RCR Capital Resolution Other: RWAs FY 2014 67.2 RWAs FY 2015 33.6 ï,§ 2015 Exceeded £25bn target RWA reduction for CIB in 2015 2016 plans Targeting further material RWA reduction by end 2016 40% shared holding(28) Exit timing to be confirmed RCR now closed, residual assets now merged... -
Page 23
... and Regulatory approval ï,§ Capital structure normalised (final DAS dividend planned in H1 2016*, B-shares now cancelled) ï,§ Williams & Glyn exit assured ï,§ Pass the peak of litigation and conduct costs, including US RMBS ï,§ Confidence in sustainable profitability ï,§ Pass 2016 BoE stress test... -
Page 24
... General and agencies continue None Please refer to Note 3 "Provisions for liabilities and charges" in the Annual Results 2015 for further information Note: RBS Securities Inc. intends to pursue a contractual claim for indemnification against Nomura (of $383m) with respect to any losses it suffers... -
Page 25
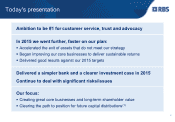
Summary Determined to build a great customer bank Strong performance against 2015 targets In 2016, targeting stabilising revenues and positive jaws - in core franchises Continue to address key issues to be able to return to shareholder distributions(1) 21 -
Page 26
Q&A -
Page 27
...(9) (10) UK PBB now includes Ulster Bank Northern Ireland and excludes Williams & Glyn, which is reported as a separate segment. All mortgage figures relate to UK PBB on this restated basis (11) 12 month growth rate at December 2015 of loans to Non-Financial Businesses (Source: Bank of England) (12... -
Page 28
...segmental return on equity (ROE), to better reflect the differential drivers of capital usage, segmental operating profit after tax and adjusted for preference dividends is divided by notional equity allocated at different rates of 11% (Commercial Banking and Ulster Bank RoI), 12% (RBS International... -
Page 29
Additional Slides -
Page 30
... co-operating with the ongoing FCA review Timing of initial findings not confirmed, but may be during H1 2016 22 (1) Includes Other regulatory provisions and Litigation as per the Annual Results 2015 p.47(note 3) (2) Closing provision primarily relates to investment advice and packaged accounts -
Page 31
... Total Expenses Restructuring(2) Litigation & Conduct Writedown of Goodwill Adjusted Expenses Of which...Write down of other intangible assets Bank levy o/w UK PBB o/w Ulster Bank RoI o/w Commercial o/w Private o/w RBSI o/w CIB o/w Capital Resolution o/w Central items (1) (2) FY 2015 12,923 309... -
Page 32
...+152% FY 2015 vs. FY 2014 ï,§ Total income was £5.2bn, down 4% due to higher treasury funding allocations, SVR to fixed rate mortgage switching and declining interchange fees ï,§ Adj. operating expenses down 3% ï,§ Litigation and conduct costs increased 6% primarily due to higher customer redress... -
Page 33
...FY 2015 vs. FY 2014 ï,§ Total income down 9% reflecting the weakening of the Euro during 2015 ï,§ NIM was 1.57%, down 35bps, driven by a lower return on free funds and an increased drag from higher liquidity requirements ï,§ Adj. operating expenses were £427m, with an increase in pension servicing... -
Page 34
... (losses) / releases Operating profit / (loss) Key metrics Net interest margin Return on equity (2) Adj. return on equity(1,2,3) Cost-income ratio Adj. cost-income ratio(1,3) Balance sheet (£bn) Net loans & advances to customers RWAs (1) (2) (3) FY 2015 3,254 (1) vs. FY 2014 (2%) +3% (36... -
Page 35
... were up 3% as a higher UK bank levy charge of £22m was partly offset by lower staff costs ï,§ Net impairment charges of £13m ï,§ Adjusted RoE of 4.9% (27.7%) (32ppts) (118.9%) Excluding restructuring costs, litigation and conduct costs and write-down of goodwill. Return on equity is based on... -
Page 36
... of goodwill. Return on equity is based on segmental operating profit after tax adjusted for preference share dividends divided by average notional equity based on 12% (previously 13%) of the monthly average of segmental RWAes, assuming 28% tax rate; previously 25%. Excluding own credit adjustments... -
Page 37
... Rates Currencies Financing Banking/ other Business transfers to CB Adjusted Income(1) Own credit adjustment Total Income Adj. operating expenses(2) Restructuring costs Litigation & conduct costs Operating Expenses Impairment (losses) / releases Operating profit / (loss) Key metrics Return on equity... -
Page 38
... Write-down of goodwill Operating Expenses Impairment (losses) / releases Operating profit / (loss) Balance sheet (£bn) Funded Assets Risk elements in lending Provision coverage RWAs RWAe (3) FY 2015 402 539 (1,539) (1,307) (2,105) (4,951) 725 (3,687) 53.4 3.4 67% 49.0 50.3 vs. FY 2014 (78%) (70... -
Page 39
... portfolio EMEA 10.5 4.0 5.9 11.0% Americas APAC 6.2% 7.8 5.0 8.2% Portfolios 4.2% 5.3% 5.7% 2.9 7.3% 3.6 3.7 RWA 49.0 4.5 9.2% 6.9 14.1% 7.6% 2.0% 4.0 1.0% 2.4% 8.2% Global Transaction Services Other Markets Operational risk Saudi Hollandi Bank Shipping 31 Legacy loan portfolio (1) SHB... -
Page 40
... UK regulators in September ï,§ Executive team in place, including appointments of Jim Brown as CEO and Leigh Bartlett as CFO (1) The illustrative financial information above is solely indicative as it is based on certain currently modelled assumptions, including cost base, funding, liquidity and... -
Page 41
... Leverage ratio (%) 4.2% +140bps 5.6% (£bn) CET 1 capital AT1 capital Tier 1 Capital Total assets Netting of derivatives Securities financing transactions Regulatory deductions & other adjustments Potential future exposures on derivatives Undrawn commitments Leverage exposure Q4 2014 Q4 2015... -
Page 42
...Value "TNAV" movements Q3 2015 £m Starting TNAV Loss for the period(1) Less: profit attributable to NCI/ other owners Other comprehensive income Less: OCI attributable to NCI / other owners Proceeds of share issuance Other movements(2) 42,937 (1,940) (141) (44) 7 161 (37) Q4 2015 End of period TNAV... -
Page 43
...FY 2014 Oil field service providers Other wholesale & trading activities Refineries Pipelines Investment grade Other rating grades Western Europe ï,§ ï,§ ï,§ Total exposure decreased 70% Y/Y due to pro active credit stewardship, together with disposals in the US and APAC At 31 December 2015, 65... -
Page 44
...40% FY 2014 FY 2015 FY 2014 Total exposure(2) by geography UK&ROI (55%) 4,696 16% 26% US Other W. Europe Rest of world(3) 2,105 1,134 63% 37% FY 2015 27% 31% 60% 38% 40% FY 2014 FY 2015 Metals Mining 2,105 28% 36% 23% 13% Investment grade Other rating grades FY 2014 FY 2015 Total exposure... -
Page 45
... (28%) FY 2014 (1) (2) (3) FY 2015 FY 2014 FY 2015 Total exposure decreased 28% Y/Y Non-performing exposures at 31 December 2015 were £362m(3) with an impairment provision of £135m LTV was 84% as at December 2015 Shipping exposures are under heightened monitoring Credit Risk Assets (CRAs... -
Page 46
... RBS's UK-centred strategy FY 2014 FY 2015 ï,§ Net Balance sheet exposure decreased by £2.5bn to £1.1bn, with reductions mostly in corporate lending, driven by RBS's strategy The portfolio is focused on the largest banks. Stress tests indicated that the impact of an economic downturn on credit... -
Page 47
Fixed Income Slides -
Page 48
FY 2015 results - Treasurer's view Strong funding and liquidity metrics maintained Good progress in CET1 ratio build Manageable MREL issuance requirements Target ~£2bn AT1 and ~£3-5bn Senior issuance in 2016(1) (1) Subject to market conditions. 39 -
Page 49
Funding & liquidity FY 2015 Loan : deposit ratio Short-term wholesale funding Liquidity portfolio Liquidity coverage ratio Net stable funding ratio Stressed outflow coverage FY 2014 89% £17bn £156bn 136% 121% 227% 95% £28bn £151bn 112% 112% 186% 40 -
Page 50
... £16.3bn vs £17.5bn at FY 2014 (1) Headroom may vary over time and may be less in future. (2) 2016 G-SIB initial phase-in based on 1.5% current requirement. RBS' G-SIB requirement will reduce to 1.0% on 1 Jan 2017. (3) RBS's Pillar 2A requirement was 5.0% of RWAs as at 31 December 2015. 56% of... -
Page 51
... is expected to vary over time and is subject to at least annual review. Following our announced changes to pension accounting and planned scheme contributions in response to amendments to IFRIC 14, RBS anticipates a reduction in RBS's future core capital requirements. The timing of any such core... -
Page 52
...position FY 2015 Estimated Loss Absorbing Capital ("LAC") position £'bn Common Equity Tier 1 Capital (5) (1) LAC value 37.6 2.0 2.0 - (1) Regulatory Value (2,3) 37.6 2.0 2.0 - Par Value 37.6 2.0 2.0 - (4) Tier 1 Capital: End point CRR compliant AT1 o/w RBS Group Plc (HoldCo) o/w RBS Operating... -
Page 53
... implementation of UK resolution Illustrative anticipated UK creditor hierarchy Based on RBS interpretation of the creditor hierarchy in a resolution scenario Holding Company Senior Subordinated Debt Losses limited to write down of intercompany assets (1) Additional Tier 1 Equity Intercompany... -
Page 54
Ring-fencing - update Target organisational structure RBS Group plc (Holding Company) (1) ï® ~80% of RWAs expected to be committed to RingFenced Bank (4) ~15% RWAs in CIB NRFB. Target well capitalised entity with an investment grade credit rating (4) Overall group supported by Bank-wide service ... -
Page 55
Sustainability Slides -
Page 56
...our business. Sustainability is therefore not just about the many responsibilities that RBS has, but about taking leadership on a broad range of issues that are important to our stakeholders." Ross McEwan, Chief Executive "RBS continues to have a clear ambition to be number one for customer service... -
Page 57
... key topics Further developing our strategy on environmental targets, climate change, sustainable energy and the social economy Transparent reporting through the independently assured annual Sustainability Review which describes our performance and approach to making RBS a more sustainable business... -
Page 58
... to equip our customer facing teams with specialist expertise in supporting women in business. Launched the £2.5m Skills & Opportunities Fund, supporting notfor-profit organisations, statefunded schools & colleges to help people start-up in business or get into employment. Signed up to a further... -
Page 59
... a sustainable bank Key benchmarks 2012 CDP RBS - Disclosure RBS - Performance Industry Av. - Disclosure Industry Av. Performance DJSI RBS Industry average Industry best FTSE4Good No score issued Included Included Included Included 89 B 66 C 88 B 70 C 98 B 69 C 99 B 84 C ï,§ 2013 2014 2015... -
Page 60
... to: The Royal Bank of Scotland Group plc's (RBS) restructuring (which includes, the separation and divestment of Williams & Glyn, the proposed restructuring of RBS's CIB business, the implementation of the UK ring-fencing regime, the implementation of a major development program to update RBS's IT...