RBS 2015 Annual Report Download - page 34
Download and view the complete annual report
Please find page 34 of the 2015 RBS annual report below. You can navigate through the pages in the report by either clicking on the pages listed below, or by using the keyword search tool below to find specific information within the annual report.-
 1
1 -
2
-
3
-
4
-
5
-
6
-
7
-
8
-
9
-
10
-
11
-
12
-
13
-
14
-
15
-
16
-
17
-
18
-
19
-
20
-
21
-
22
-
23
-
 24
24 -
 25
25 -
 26
26 -
 27
27 -
 28
28 -
 29
29 -
 30
30 -
 31
31 -
 32
32 -
 33
33 -
 34
34 -
 35
35 -
 36
36 -
 37
37 -
 38
38 -
 39
39 -
 40
40 -
 41
41 -
 42
42 -
 43
43 -
 44
44 -
45
-
46
-
47
-
48
-
49
-
50
-
51
-
52
-
53
-
54
-
55
-
56
-
57
-
58
-
59
-
60
 |
 |

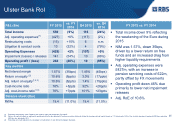
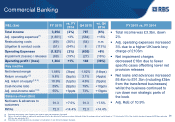
FY 2015 vs. FY 2014
26
P&L (£m) FY 2015 vs. FY
2014 Q4 2015 vs. Q4
2014
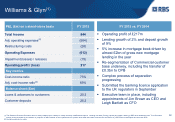
Total Income
3,254 (2%) 797 (6%)
Adj. operating expenses
(1) (1,801) +3% (584) +15%
Restructuring costs
(69) (36%) (54) n.m.
Litigation & conduct costs
(51) (54%) 8 (113%)
Operating Expenses
(1,921) (2%) (630) +8%
Impairment (losses) / releases
(69) (19%) (27) (16%)
Operating profit / (loss)
1,264 +1% 140 (39%)
Key metrics
Net interest margin
1.88% (3bps) 1.82% (14bps)
Return on equity
(2) 9.8% (0ppts) 3.1% (4ppts)
Adj. return on equity
(1,2,3) 10.9% (1ppts) 4.6% (5ppts)
Cost
-income ratio 59% (0ppts) 79% +10ppts
Adj. cost
-income ratio(1,3) 55% +3ppts 73% +13ppts
Balance sheet (£bn)
Net loans & advances to
customers
91.3 +7.5% 91.3 +7.5%
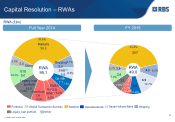
RWAs
72.3 +14.4% 72.3 +14.4%
Commercial Banking
Total income was £3.3bn, down
2%
Adj. operating expenses increased
3% due to a higher UK bank levy
charge of £103m
Net impairment charges
decreased £16m due to fewer
specific cases offsetting lower net
provision releases
Net loans and advances increased
£6.4bn to £91.3bn (including £5bn
from the transferred businesses)
whilst the business continued to
run down non strategic parts of
the book
Adj. RoE of 10.9%
(1) Excluding restructuring costs, litigation and conduct costs and write-down of goodwill.
(2) Return on equity is based on segmental operating profit after tax adjusted for preference share dividends divided by average notional equity based on 11% (previously 13%) of the monthly average of segmental RWAes, assuming
28% tax rate; previously 25%.
(3) Excluding own credit adjustments, (loss)/gain on redemption of own debt and strategic disposals.