RBS 2015 Annual Report Download - page 20
Download and view the complete annual report
Please find page 20 of the 2015 RBS annual report below. You can navigate through the pages in the report by either clicking on the pages listed below, or by using the keyword search tool below to find specific information within the annual report.-
 1
1 -
2
-
3
-
4
-
5
-
6
-
7
-
8
-
9
-
 10
10 -
 11
11 -
 12
12 -
 13
13 -
 14
14 -
 15
15 -
 16
16 -
 17
17 -
 18
18 -
 19
19 -
 20
20 -
 21
21 -
 22
22 -
 23
23 -
 24
24 -
 25
25 -
 26
26 -
 27
27 -
 28
28 -
 29
29 -
 30
30 -
31
-
32
-
33
-
34
-
35
-
36
-
37
-
38
-
39
-
40
-
41
-
42
-
43
-
44
-
45
-
46
-
47
-
48
-
49
-
50
-
51
-
52
-
53
-
54
-
55
-
56
-
57
-
58
-
59
-
60
 |
 |
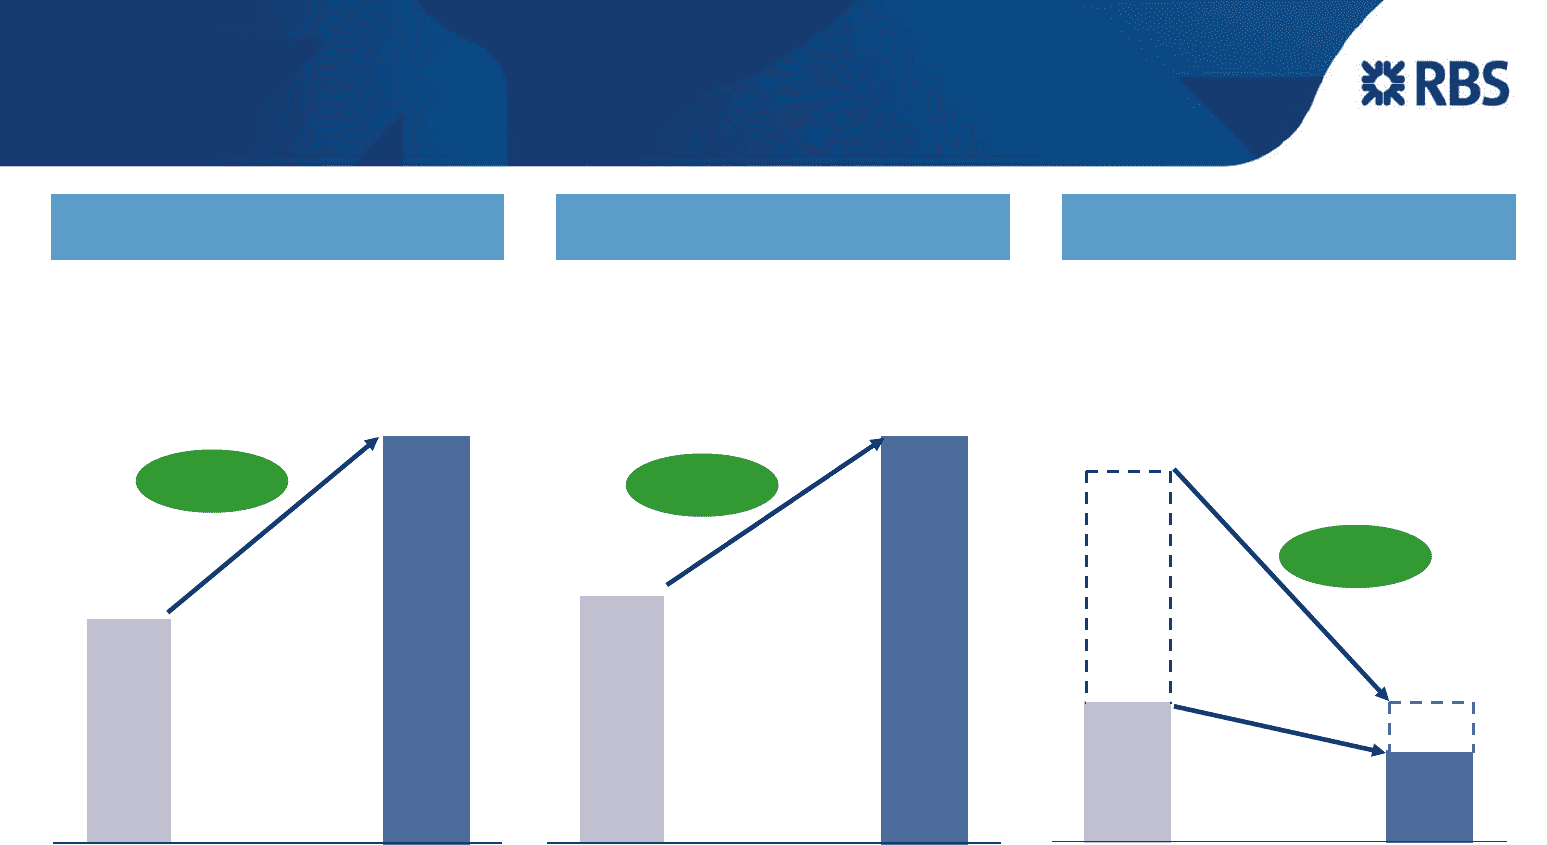
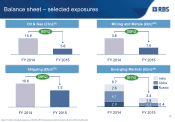
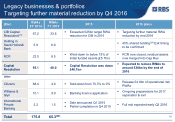
FY 2015
15.5%
FY 2013
8.6%
FY 2015
12.2
(3.9%)
FY 2013
39.4
(9.4%)
Ex
Cap
Res
19.1
Cap
Res
20.3
CET1 Ratio: 13% Target
+690bps
FY 2015 FY 2013
5.6%
3.4%
REILs (£bn) Leverage Ratio
(as % of Total Gross L&As)
8.8
Balance sheet – resilience
+220bps
(69%)
3.4
Excluding Capital Resolution REILs were 3.0% of Total Gross L&As (Ex Capital Resolution)
at FY 2015
16