RBS 2015 Annual Report Download - page 17
Download and view the complete annual report
Please find page 17 of the 2015 RBS annual report below. You can navigate through the pages in the report by either clicking on the pages listed below, or by using the keyword search tool below to find specific information within the annual report.-
 1
1 -
2
-
3
-
4
-
5
-
6
-
 7
7 -
 8
8 -
 9
9 -
 10
10 -
 11
11 -
 12
12 -
 13
13 -
 14
14 -
 15
15 -
 16
16 -
 17
17 -
 18
18 -
 19
19 -
 20
20 -
 21
21 -
 22
22 -
 23
23 -
 24
24 -
 25
25 -
 26
26 -
 27
27 -
28
-
29
-
30
-
31
-
32
-
33
-
34
-
35
-
36
-
37
-
38
-
39
-
40
-
41
-
42
-
43
-
44
-
45
-
46
-
47
-
48
-
49
-
50
-
51
-
52
-
53
-
54
-
55
-
56
-
57
-
58
-
59
-
60
 |
 |
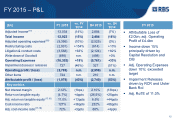
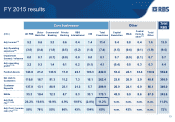
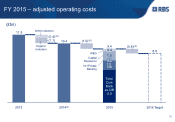
FY 2015 results
13
Core businesses
Other
Total
RBS
(£
bn) UK PBB Ulster
Bank RoI
Commercial
Banking
Private
Banking
RBS
International
CIB Total
Franchises
Capital
Resolution
W&G
Central
items &
other(19)
Total
Other
Adj.
Income(17) 5.2 0.6 3.3 0.6 0.4 1.4 11.4
0.4 0.8 0.4 1.6
13.0
Adj. Operating
expenses
(18) (3.0) (0.4) (1.8) (0.5) (0.2) (1.5) (7.4)
(1.5) (0.4) (0.1) (1.9)
(9.4)
Impairment
(losses) / releases
0.0 0.1 (0.1) (0.0) 0.0 0.0 0.1
0.7 (0.0) (0.1) 0.7
0.7
Adj. operating
profit
(17,18) 2.2 0.3 1.4 0.1 0.2 (0.1) 4.1
(0.4) 0.5 0.3 0.3
4.4
Funded Assets
143.9 21.2 133.5 17.0 23.1 103.3 442.0
53.4 24.1 33.4 110.9
552.9
Net L&A to
Customers
119.8 16.7 91.3 11.2 7.3 16.1 262.4
23.6 20.0 2.0 45.6
308.0
Customer
Deposits
137.8 13.1 88.9 23.1 21.3 5.7 289.9
26.0 24.1 6.0 56.1
346.0
RWAs
33.3 19.4 72.3 8.7 8.3 33.1 175.1
49.0 9.9 8.6 67.5
242.6
Adj.
RoE
(%)
(17,18,20) 26.2% 10.6% 10.9% 4.9% 18.9% (2.0%) 11.2%
n.m. n.m. n.m. n.m.
11.0%
Adj. Cost : Income
ratio
(%)(17,18) 58% 78% 55% 80% 43% 104% 65%
n.m. 43% n.m. n.m.
72%