RBS 2015 Annual Report Download - page 21
Download and view the complete annual report
Please find page 21 of the 2015 RBS annual report below. You can navigate through the pages in the report by either clicking on the pages listed below, or by using the keyword search tool below to find specific information within the annual report.-
 1
1 -
2
-
3
-
4
-
5
-
6
-
7
-
8
-
9
-
10
-
 11
11 -
 12
12 -
 13
13 -
 14
14 -
 15
15 -
 16
16 -
 17
17 -
 18
18 -
 19
19 -
 20
20 -
 21
21 -
 22
22 -
 23
23 -
 24
24 -
 25
25 -
 26
26 -
 27
27 -
 28
28 -
 29
29 -
 30
30 -
 31
31 -
32
-
33
-
34
-
35
-
36
-
37
-
38
-
39
-
40
-
41
-
42
-
43
-
44
-
45
-
46
-
47
-
48
-
49
-
50
-
51
-
52
-
53
-
54
-
55
-
56
-
57
-
58
-
59
-
60
 |
 |

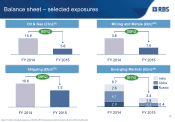
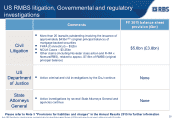
Balance sheet – selected exposures
5.6
15.9
(65%)
FY 2015 FY 2014
1.6
3.8
FY 2015 FY 2014
(58%)
Oil & Gas (£bn)(25) Mining and Metals (£bn)(25)
Note: For further information please see p.198 of the 2015 Annual report and accounts and p.30 of the 2015 Annual Results
Shipping (£bn)(25) Emerging Markets (£bn)(26)
7.5
10.6
(29%)
FY 2015 FY 2014
2.6
1.9
0.4
2.0
4.1
1.1
FY 2014
8.7
(61%)
FY 2015
3.4
Russia
India
China
17