RBS 2015 Annual Report Download - page 16
Download and view the complete annual report
Please find page 16 of the 2015 RBS annual report below. You can navigate through the pages in the report by either clicking on the pages listed below, or by using the keyword search tool below to find specific information within the annual report.-
 1
1 -
2
-
3
-
4
-
5
-
 6
6 -
 7
7 -
 8
8 -
 9
9 -
 10
10 -
 11
11 -
 12
12 -
 13
13 -
 14
14 -
 15
15 -
 16
16 -
 17
17 -
 18
18 -
 19
19 -
 20
20 -
 21
21 -
 22
22 -
 23
23 -
 24
24 -
 25
25 -
 26
26 -
27
-
28
-
29
-
30
-
31
-
32
-
33
-
34
-
35
-
36
-
37
-
38
-
39
-
40
-
41
-
42
-
43
-
44
-
45
-
46
-
47
-
48
-
49
-
50
-
51
-
52
-
53
-
54
-
55
-
56
-
57
-
58
-
59
-
60
 |
 |

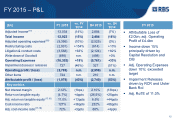
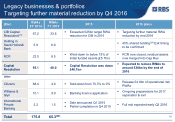
FY 2015 – P&L
12
(£m) FY 2015 vs. FY
2014 Q4 2015 vs. Q4
2014
Adjusted Income(17) 13,034 (14%) 2,884 (7%)
Total Income 12,923 (15%) 2,484 (16%)
Adjusted operating expenses(18) (9,356) (10%) (2,525) (3%)
Restructuring costs (2,931) +154% (614) +13%
Litigation & conduct costs (3,568) +63% (2,124) +82%
Write-down of Goodwill (498) n.m. (498) +0%
Operating Expenses (16,353) +18% (5,761) +33%
Impairment (losses) / releases 727 (46%) 327 (51%)
Operating profit / (loss) (2,703) n.m. (2,950) n.m.
Other items 724 n.m. 210 n.m.
Attributable profit / (loss) (1,979) (43%) (2,740) (53%)
Key metrics
Net interest margin 2.12% (1bps) 2.10% (13bps)
Return on tangible equity (4.7%) +4ppts (26.5%) +25ppts
Adj. return on tangible equity(17,18) 11.0% +13ppts 6.6% +44ppts
Cost-income ratio 127% +36ppts 232% +86ppts
Adj. cost-income ratio(17,18) 72% +3ppts 88% +4ppts
FY 2015
Attributable Loss of
£2.0bn; adj. Operating
Profit of £4.4bn
Income down 15%
principally driven by
Capital Resolution and
CIB
Adj. Operating Expenses
down 10%; exceeded
target
Impairment Releases
driven by RCR and Ulster
Bank RoI
Adj. RoTE of 11.0%