RBS 2015 Annual Report Download - page 46
Download and view the complete annual report
Please find page 46 of the 2015 RBS annual report below. You can navigate through the pages in the report by either clicking on the pages listed below, or by using the keyword search tool below to find specific information within the annual report.-
 1
1 -
2
-
3
-
4
-
5
-
6
-
7
-
8
-
9
-
10
-
11
-
12
-
13
-
14
-
15
-
16
-
17
-
18
-
19
-
20
-
21
-
22
-
23
-
24
-
25
-
26
-
27
-
28
-
29
-
30
-
31
-
32
-
33
-
34
-
35
-
 36
36 -
 37
37 -
 38
38 -
 39
39 -
 40
40 -
 41
41 -
 42
42 -
 43
43 -
 44
44 -
 45
45 -
 46
46 -
 47
47 -
 48
48 -
 49
49 -
 50
50 -
 51
51 -
 52
52 -
 53
53 -
 54
54 -
 55
55 -
 56
56 -
57
-
58
-
59
-
60
 |
 |
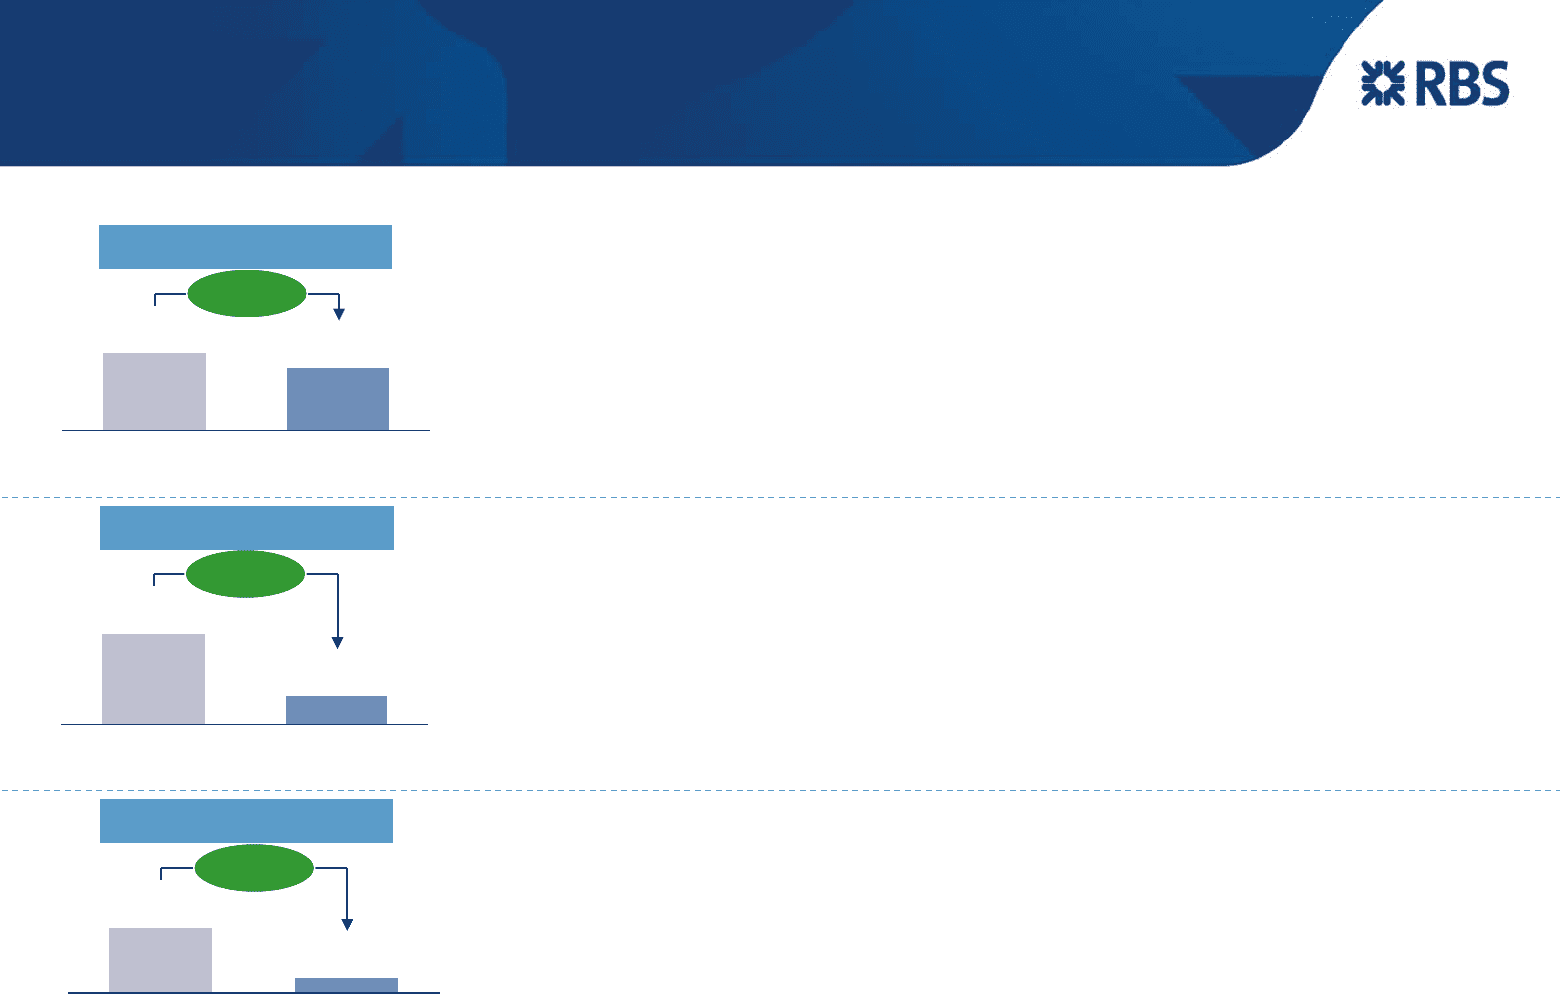
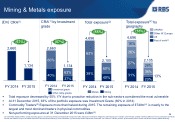
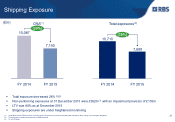
Emerging Markets exposure
Net Balance sheet exposure decreased by £1.4bn to £0.4bn, partly through
loan sales in H2 2015
The remaining exposure consists mainly of lending to banks, with risks
largely mitigated
Net Balance sheet exposure fell by £0.4bn to £1.6bn with reductions mainly in
corporate lending, reflecting RBS’s UK-centred strategy
Net Balance sheet exposure decreased by £2.5bn to £1.1bn, with reductions mostly
in corporate lending, driven by RBS’s strategy
The portfolio is focused on the largest banks. Stress tests indicated that the impact
of an economic downturn on credit losses would be limited
38
Total Net Balance sheet exposures(1) (£bn)
1.6
2.0
FY 2015 FY 2014
(20%)
1.1
3.5
FY 2015 FY 2014
(69%)
0.4
1.8
FY 2015 FY 2014
(78%)
India
Russia
China
(1) Net balance sheet exposure - Comprises net lending, debt securities, derivatives (net) and SFT (net) exposures.