RBS 2015 Annual Report Download - page 41
Download and view the complete annual report
Please find page 41 of the 2015 RBS annual report below. You can navigate through the pages in the report by either clicking on the pages listed below, or by using the keyword search tool below to find specific information within the annual report.-
 1
1 -
2
-
3
-
4
-
5
-
6
-
7
-
8
-
9
-
10
-
11
-
12
-
13
-
14
-
15
-
16
-
17
-
18
-
19
-
20
-
21
-
22
-
23
-
24
-
25
-
26
-
27
-
28
-
29
-
30
-
 31
31 -
 32
32 -
 33
33 -
 34
34 -
 35
35 -
 36
36 -
 37
37 -
 38
38 -
 39
39 -
 40
40 -
 41
41 -
 42
42 -
 43
43 -
 44
44 -
 45
45 -
 46
46 -
 47
47 -
 48
48 -
 49
49 -
 50
50 -
 51
51 -
52
-
53
-
54
-
55
-
56
-
57
-
58
-
59
-
60
 |
 |

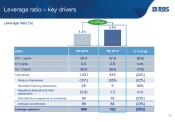
Leverage ratio (%)
(£bn) % change
CET 1 capital 39.9 37.6 (6%)
AT1 capital 0.0 2.0 n.m.
Tier 1 Capital 39.9 39.6 (1%)
Total assets 1,051 815 (22%)
Netting of derivatives (331) (259) (22%)
Securities financing transactions 25 5 80%
Regulatory deductions & other
adjustments (0.8) 1.5 n.m.
Potential future exposures on derivatives 99 76 (23%)
Undrawn commitments 96 64 (33%)
Leverage exposure 940 703 (25%)
4.2%
+140bps
Q4 2014
5.6%
Q4 2015
Leverage ratio – key drivers
33