Sprint - Nextel 2011 Annual Report Download - page 110
Download and view the complete annual report
Please find page 110 of the 2011 Sprint - Nextel annual report below. You can navigate through the pages in the report by either clicking on the pages listed below, or by using the keyword search tool below to find specific information within the annual report.-
 1
1 -
2
-
3
-
4
-
5
-
6
-
7
-
8
-
9
-
10
-
11
-
12
-
13
-
14
-
15
-
16
-
17
-
18
-
19
-
20
-
21
-
22
-
23
-
24
-
25
-
26
-
27
-
28
-
29
-
30
-
31
-
32
-
33
-
34
-
35
-
36
-
37
-
38
-
39
-
40
-
41
-
42
-
43
-
44
-
45
-
46
-
47
-
48
-
49
-
50
-
51
-
52
-
53
-
54
-
55
-
56
-
57
-
58
-
59
-
60
-
61
-
62
-
63
-
64
-
65
-
66
-
67
-
68
-
69
-
70
-
71
-
72
-
73
-
74
-
75
-
76
-
77
-
78
-
79
-
80
-
81
-
82
-
83
-
84
-
85
-
86
-
87
-
88
-
89
-
90
-
91
-
92
-
93
-
94
-
95
-
96
-
97
-
98
-
99
-
 100
100 -
 101
101 -
 102
102 -
 103
103 -
 104
104 -
 105
105 -
 106
106 -
 107
107 -
 108
108 -
 109
109 -
 110
110 -
 111
111 -
 112
112 -
 113
113 -
 114
114 -
 115
115 -
 116
116 -
 117
117 -
 118
118 -
 119
119 -
 120
120 -
121
-
122
-
123
-
124
-
125
-
126
-
127
-
128
-
129
-
130
-
131
-
132
-
133
-
134
-
135
-
136
-
137
-
138
-
139
-
140
-
141
-
142
-
143
-
144
-
145
-
146
-
147
-
148
-
149
-
150
-
151
-
152
-
153
-
154
-
155
-
156
-
157
-
158
-
159
-
160
-
161
-
162
-
163
-
164
-
165
-
166
-
167
-
168
-
169
-
170
-
171
-
172
-
173
-
174
-
175
-
176
-
177
-
178
-
179
-
180
-
181
-
182
-
183
-
184
-
185
-
186
-
187
-
188
-
189
-
190
-
191
-
192
-
193
-
194
-
195
-
196
-
197
-
198
-
199
-
200
-
201
-
202
-
203
-
204
-
205
-
206
-
207
-
208
-
209
-
210
-
211
-
212
-
213
-
214
-
215
-
216
-
217
-
218
-
219
-
220
-
221
-
222
-
223
-
224
-
225
-
226
-
227
-
228
-
229
-
230
-
231
-
232
-
233
-
234
-
235
-
236
-
237
-
238
-
239
-
240
-
241
-
242
-
243
-
244
-
245
-
246
-
247
-
248
-
249
-
250
-
251
-
252
-
253
-
254
-
255
-
256
-
257
-
258
-
259
-
260
-
261
-
262
-
263
-
264
-
265
-
266
-
267
-
268
-
269
-
270
-
271
-
272
-
273
-
274
-
275
-
276
-
277
-
278
-
279
-
280
-
281
-
282
-
283
-
284
-
285
-
286
-
287
-
288
-
289
-
290
-
291
-
292
-
293
-
294
-
295
-
296
-
297
-
298
-
299
-
300
-
301
-
302
-
303
-
304
-
305
-
306
-
307
-
308
-
309
-
310
-
311
-
312
-
313
-
314
-
315
-
316
-
317
-
318
-
319
-
320
-
321
-
322
-
323
-
324
-
325
-
326
-
327
-
328
-
329
-
330
-
331
-
332
 |
 |

Table of Contents
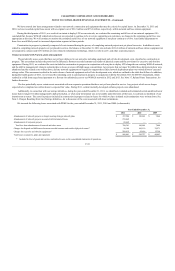
CLEARWIRE CORPORATION AND SUBSIDIARIES
CONSOLIDATED STATEMENTS OF STOCKHOLDERS’ EQUITY AND COMPREHENSIVE LOSS
For the Years Ended December 31, 2011, 2010 and 2009
See notes to consolidated financial statements
F-43
Class A
Common Stock Class B
Common Stock
Shares Amounts Shares Amounts
Additional
Paid In
Capital
Accumulated
Other
Comprehensive
Income Accumulated
Deficit
Non-
controlling
Interests
Total
Stockholders’
Equity
(In thousands)
Balances at December 31, 2008 190,002 $19
505,000 $51
$ 2,092,861 $ 3,194 $ (29,933) $ 5,436,618 $ 7,502,810
Net loss from continuing operations
—
—
—
—
—
—
(313,747) (894,841) (1,208,588)
Net loss from discontinued operations
—
—
—
—
—
—
(11,835) (33,423) (45,258)
Foreign currency translation adjustment
—
—
—
—
—
254
—
42 296
Unrealized gain on investments
—
—
—
—
—
297
—
1,622 1,919
Comprehensive loss (926,600) (1,251,631)
Issuance of common stock, net of issuance
costs, and other capital transactions 6,765 1 229,239 22 (104,148)
—
(57,541) 1,655,675 1,494,009
Share-based compensation and other
transactions
—
—
—
—
11,348
—
—
15,832 27,180
Balances at December 31, 2009 196,767 20 734,239 73 2,000,061 3,745 (413,056) 6,181,525 7,772,368
Net loss from continuing operations
—
—
—
—
—
—
(475,362) (1,775,840) (2,251,202)
Net loss from discontinued operations
—
—
—
—
—
—
(12,075) (39,817) (51,892)
Foreign currency translation adjustment
—
—
—
—
—
(1,180)
—
(5,042) (6,222)
Unrealized gain on investments
—
—
—
—
—
437
—
1,917 2,354
Comprehensive loss (1,818,782) (2,306,962)
Issuance of common stock, net of issuance
costs, and other capital transactions 46,777 4 9,242 1 208,385 (507)
—
150,123 358,006
Share-based compensation and other
transactions
—
—
—
—
12,664
—
—
33,922 46,586
Balances at December 31, 2010 243,544 24 743,481 74 2,221,110 2,495 (900,493) 4,546,788 5,869,998
Net loss from continuing operations
—
—
—
—
—
—
(696,902) (2,158,831) (2,855,733)
Net loss from discontinued operations
—
—
—
—
—
—
(20,431) (61,379) (81,810)
Foreign currency translation adjustment
—
—
—
—
—
1,149
—
2,764 3,913
Unrealized loss on investments
—
—
—
—
—
(1,515)
—
(4,615) (6,130)
Comprehensive loss (2,222,061) (2,939,760)
Issuance of common stock, net of issuance
costs, and other capital transactions 208,671 21 173,635 17 478,394 664
—
210,088 689,184
Surrender of Class B common stock
—
—
(77,413) (8)
—
—
—
—
(8)
Share-based compensation and other
transactions
—
—
—
—
15,130
—
—
11,494 26,624
Balances at December 31, 2011 452,215 $45
839,703 $83
$ 2,714,634 $ 2,793 $ (1,617,826) $ 2,546,309 $ 3,646,038