Sprint - Nextel 2011 Annual Report Download - page 119
Download and view the complete annual report
Please find page 119 of the 2011 Sprint - Nextel annual report below. You can navigate through the pages in the report by either clicking on the pages listed below, or by using the keyword search tool below to find specific information within the annual report.-
 1
1 -
2
-
3
-
4
-
5
-
6
-
7
-
8
-
9
-
10
-
11
-
12
-
13
-
14
-
15
-
16
-
17
-
18
-
19
-
20
-
21
-
22
-
23
-
24
-
25
-
26
-
27
-
28
-
29
-
30
-
31
-
32
-
33
-
34
-
35
-
36
-
37
-
38
-
39
-
40
-
41
-
42
-
43
-
44
-
45
-
46
-
47
-
48
-
49
-
50
-
51
-
52
-
53
-
54
-
55
-
56
-
57
-
58
-
59
-
60
-
61
-
62
-
63
-
64
-
65
-
66
-
67
-
68
-
69
-
70
-
71
-
72
-
73
-
74
-
75
-
76
-
77
-
78
-
79
-
80
-
81
-
82
-
83
-
84
-
85
-
86
-
87
-
88
-
89
-
90
-
91
-
92
-
93
-
94
-
95
-
96
-
97
-
98
-
99
-
100
-
101
-
102
-
103
-
104
-
105
-
106
-
107
-
108
-
 109
109 -
 110
110 -
 111
111 -
 112
112 -
 113
113 -
 114
114 -
 115
115 -
 116
116 -
 117
117 -
 118
118 -
 119
119 -
 120
120 -
 121
121 -
 122
122 -
 123
123 -
 124
124 -
 125
125 -
 126
126 -
 127
127 -
 128
128 -
 129
129 -
130
-
131
-
132
-
133
-
134
-
135
-
136
-
137
-
138
-
139
-
140
-
141
-
142
-
143
-
144
-
145
-
146
-
147
-
148
-
149
-
150
-
151
-
152
-
153
-
154
-
155
-
156
-
157
-
158
-
159
-
160
-
161
-
162
-
163
-
164
-
165
-
166
-
167
-
168
-
169
-
170
-
171
-
172
-
173
-
174
-
175
-
176
-
177
-
178
-
179
-
180
-
181
-
182
-
183
-
184
-
185
-
186
-
187
-
188
-
189
-
190
-
191
-
192
-
193
-
194
-
195
-
196
-
197
-
198
-
199
-
200
-
201
-
202
-
203
-
204
-
205
-
206
-
207
-
208
-
209
-
210
-
211
-
212
-
213
-
214
-
215
-
216
-
217
-
218
-
219
-
220
-
221
-
222
-
223
-
224
-
225
-
226
-
227
-
228
-
229
-
230
-
231
-
232
-
233
-
234
-
235
-
236
-
237
-
238
-
239
-
240
-
241
-
242
-
243
-
244
-
245
-
246
-
247
-
248
-
249
-
250
-
251
-
252
-
253
-
254
-
255
-
256
-
257
-
258
-
259
-
260
-
261
-
262
-
263
-
264
-
265
-
266
-
267
-
268
-
269
-
270
-
271
-
272
-
273
-
274
-
275
-
276
-
277
-
278
-
279
-
280
-
281
-
282
-
283
-
284
-
285
-
286
-
287
-
288
-
289
-
290
-
291
-
292
-
293
-
294
-
295
-
296
-
297
-
298
-
299
-
300
-
301
-
302
-
303
-
304
-
305
-
306
-
307
-
308
-
309
-
310
-
311
-
312
-
313
-
314
-
315
-
316
-
317
-
318
-
319
-
320
-
321
-
322
-
323
-
324
-
325
-
326
-
327
-
328
-
329
-
330
-
331
-
332
 |
 |

Table of Contents
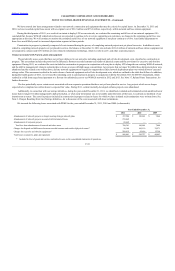
CLEARWIRE CORPORATION AND SUBSIDIARIES
NOTES TO CONSOLIDATED FINANCIAL STATEMENTS - (Continued)
Investments as of December 31, 2011 and 2010 consisted of the following (in thousands):
Other debt securities include investments in collateralized debt obligations, which we refer to as CDOs, supported by preferred equity securities of insurance
companies and financial institutions with stated final maturity dates in 2033 and 2034. During the fourth quarter of 2011, we sold the CDOs for total proceeds of $13.9
million and reclassified a gain of $4.9 million out of Accumulated other comprehensive income to Other income (expense), net on the consolidated statements of
operations representing the difference between cost of $9.0 million and the total proceeds received. We also own Auction Market Preferred securities issued by a
monoline insurance company which are perpetual and do not have a final stated maturity. Our Auction Market Preferred securities were fully written down and had no fair
value at December 31, 2011 and 2010.
No other-than-temporary impairment losses were recorded for the years ended December 31, 2011 or 2010. For the year ended December 31, 2009 we recorded an
other-than-temporary impairment loss of $10.0 million related to our other debt securities.
Property, plant and equipment as of December 31, 2011 and 2010 consisted of the following (in thousands):
F-52
4. Investments
December 31, 2011 December 31, 2010
Gross Unrealized Gross Unrealized
Cost Gains Losses Fair Value Cost Gains Losses Fair Value
Short-term
U.S. Government and
Agency Issues $ 215,627 $ 36 $ (8) $ 215,655 $ 502,121 $ 198 $ (3) $ 502,316
Long-term
Other debt securities
—
—
—
—
8,959 6,292
—
15,251
Total investments $ 215,627 $ 36 $ (8) $ 215,655 $ 511,080 $ 6,490 $ (3) $ 517,567
5. Property, Plant and Equipment
Useful December 31,
Lives (Years) 2011 2010
Network and base station equipment 5-15 $ 3,350,696 $ 3,147,517
Customer premise equipment 2 82,545 141,122
Furniture, fixtures and equipment 3-7 450,254 430,451
Leasehold improvements
Lessor of useful life or
lease term 46,435 49,402
Construction in progress N/A 262,761 1,295,136
4,192,691 5,063,628
Less: accumulated depreciation and amortization (1,178,414) (616,254)
$ 3,014,277 $ 4,447,374
Year Ended December 31,
2011 2010 2009
Supplemental information (in thousands):
Capitalized interest $ 18,823 $ 208,595 $ 140,168
Depreciation expense $ 665,344 $ 427,850 $ 160,230