Sprint - Nextel 2011 Annual Report Download - page 33
Download and view the complete annual report
Please find page 33 of the 2011 Sprint - Nextel annual report below. You can navigate through the pages in the report by either clicking on the pages listed below, or by using the keyword search tool below to find specific information within the annual report.-
 1
1 -
2
-
3
-
4
-
5
-
6
-
7
-
8
-
9
-
10
-
11
-
12
-
13
-
14
-
15
-
16
-
17
-
18
-
19
-
20
-
21
-
22
-
 23
23 -
 24
24 -
 25
25 -
 26
26 -
 27
27 -
 28
28 -
 29
29 -
 30
30 -
 31
31 -
 32
32 -
 33
33 -
 34
34 -
 35
35 -
 36
36 -
 37
37 -
 38
38 -
 39
39 -
 40
40 -
 41
41 -
 42
42 -
 43
43 -
44
-
45
-
46
-
47
-
48
-
49
-
50
-
51
-
52
-
53
-
54
-
55
-
56
-
57
-
58
-
59
-
60
-
61
-
62
-
63
-
64
-
65
-
66
-
67
-
68
-
69
-
70
-
71
-
72
-
73
-
74
-
75
-
76
-
77
-
78
-
79
-
80
-
81
-
82
-
83
-
84
-
85
-
86
-
87
-
88
-
89
-
90
-
91
-
92
-
93
-
94
-
95
-
96
-
97
-
98
-
99
-
100
-
101
-
102
-
103
-
104
-
105
-
106
-
107
-
108
-
109
-
110
-
111
-
112
-
113
-
114
-
115
-
116
-
117
-
118
-
119
-
120
-
121
-
122
-
123
-
124
-
125
-
126
-
127
-
128
-
129
-
130
-
131
-
132
-
133
-
134
-
135
-
136
-
137
-
138
-
139
-
140
-
141
-
142
-
143
-
144
-
145
-
146
-
147
-
148
-
149
-
150
-
151
-
152
-
153
-
154
-
155
-
156
-
157
-
158
-
159
-
160
-
161
-
162
-
163
-
164
-
165
-
166
-
167
-
168
-
169
-
170
-
171
-
172
-
173
-
174
-
175
-
176
-
177
-
178
-
179
-
180
-
181
-
182
-
183
-
184
-
185
-
186
-
187
-
188
-
189
-
190
-
191
-
192
-
193
-
194
-
195
-
196
-
197
-
198
-
199
-
200
-
201
-
202
-
203
-
204
-
205
-
206
-
207
-
208
-
209
-
210
-
211
-
212
-
213
-
214
-
215
-
216
-
217
-
218
-
219
-
220
-
221
-
222
-
223
-
224
-
225
-
226
-
227
-
228
-
229
-
230
-
231
-
232
-
233
-
234
-
235
-
236
-
237
-
238
-
239
-
240
-
241
-
242
-
243
-
244
-
245
-
246
-
247
-
248
-
249
-
250
-
251
-
252
-
253
-
254
-
255
-
256
-
257
-
258
-
259
-
260
-
261
-
262
-
263
-
264
-
265
-
266
-
267
-
268
-
269
-
270
-
271
-
272
-
273
-
274
-
275
-
276
-
277
-
278
-
279
-
280
-
281
-
282
-
283
-
284
-
285
-
286
-
287
-
288
-
289
-
290
-
291
-
292
-
293
-
294
-
295
-
296
-
297
-
298
-
299
-
300
-
301
-
302
-
303
-
304
-
305
-
306
-
307
-
308
-
309
-
310
-
311
-
312
-
313
-
314
-
315
-
316
-
317
-
318
-
319
-
320
-
321
-
322
-
323
-
324
-
325
-
326
-
327
-
328
-
329
-
330
-
331
-
332
 |
 |

Table of Contents
Depreciation and Amortization Expense
During 2011, Sprint completed studies of the estimated useful lives of depreciable assets, which reflects a reduction in the replacement rate of capital additions
and was a primary factor for a decrease to depreciation expense of $619 million, or 12%, in 2011 compared to 2010. This decline is partially offset by an increase due to
assets placed in service as a result of capital expenditures related to capacity to support increased data usage by our subscribers. As a result of expected increased capital
expenditures related to Network Vision, we expect depreciation expense to increase over the next several years as those assets are placed in service. In addition, the
successful deployment related to the changes in technology as a result of Network Vision is expected to result in incremental charges during the period of implementation
including, but not limited to, an increase in depreciation and amortization associated with existing assets, both Nextel and Sprint platform related, due to changes in our
estimates of the remaining useful lives of long-lived assets, and the expected timing of asset retirement obligations, which we expect to have a material impact on our
results of operations. Depreciation expense decreased $753 million, or 13%, in 2010 compared to 2009 primarily due to a reduction in the replacement rate of capital
additions resulting from reduced capital spending associated with our cost control actions beginning in 2008. The average annual capital expenditures for the three years
ended 2007 were approximately $6.3 billion as compared to average annual capital expenditures of $2.5 billion for the three years ended 2010.
Amortization expense declined $771 million, or 66%, in 2011 compared to 2010 primarily due to the absence of amortization for customer relationship
intangible assets related to the 2005 acquisition of Nextel, which became fully amortized in the second quarter 2010. In addition, customer relationship intangible assets
related to the acquisition of Nextel Partners, Inc. in 2006 and Virgin Mobile USA, Inc. (Virgin Mobile) in the fourth quarter 2009 became fully amortized in the second
quarter 2011. Amortization expense declined $415 million, or 26%, in 2010 as compared to 2009, primarily due to the absence of amortization for customer relationship
intangible assets related to the 2005 acquisition of Nextel which became fully amortized in the second quarter 2010. These reductions were partially offset by an increase
in amortization related to customer relationship intangible assets acquired in connection with the iPCS, Inc. (iPCS) and Virgin Mobile acquisitions in the fourth quarter
2009. Customer relationships are amortized using the sum-of-the-years'-digits method, resulting in higher amortization rates in early periods that decline over time.
Other, net
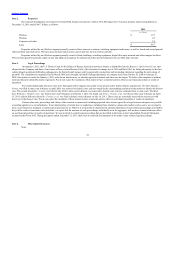
The following table provides additional information of items included in “Other, net” for the years ended December 31, 2011, 2010 and 2009.
Other, net changed $126 million, or 630%, in 2011 compared to 2010 and $409 million, or 105%, in 2010 compared to 2009. During 2011 we recognized
severance and exit costs of $28 million associated with actions in the fourth quarter of 2011. During 2010 we recognized $8 million of severance and exit costs primarily
related to exit costs incurred in the second and fourth quarter 2010 associated with vacating certain office space which is no longer being utilized. We recognized $400
million in 2009 of severance and exit costs related to the separation of employees and organizational realignment initiatives. Asset impairments decreased by $47 million,
or 38%, in 2011 compared to 2010 and increased $78 million, or 166%, in 2010 compared to 2009. Asset impairments primarily relate to assets that are no longer
necessary for management's strategic plans. In 2011, 2010, and 2009 these impairments were primarily related to network asset equipment. Gains from asset dispositions
and exchanges for 2010 and 2009 are primarily related to spectrum exchange transactions. Other changed $94 million in 2010 as compared to 2009 primarily due to an
increase in benefits resulting from favorable developments relating to access cost disputes with certain exchange carriers.
31
Year Ended December 31,
2011 2010 2009
(in millions)
Severance and exit costs $ (28) $ (8) $ (400)
Asset impairments (78) (125) (47)
Gains from asset dispositions and exchanges
—
69 68
Other
—
84 (10)
Total $ (106) $20
$ (389)