Sprint - Nextel 2011 Annual Report Download - page 73
Download and view the complete annual report
Please find page 73 of the 2011 Sprint - Nextel annual report below. You can navigate through the pages in the report by either clicking on the pages listed below, or by using the keyword search tool below to find specific information within the annual report.-
 1
1 -
2
-
3
-
4
-
5
-
6
-
7
-
8
-
9
-
10
-
11
-
12
-
13
-
14
-
15
-
16
-
17
-
18
-
19
-
20
-
21
-
22
-
23
-
24
-
25
-
26
-
27
-
28
-
29
-
30
-
31
-
32
-
33
-
34
-
35
-
36
-
37
-
38
-
39
-
40
-
41
-
42
-
43
-
44
-
45
-
46
-
47
-
48
-
49
-
50
-
51
-
52
-
53
-
54
-
55
-
56
-
57
-
58
-
59
-
60
-
61
-
62
-
 63
63 -
 64
64 -
 65
65 -
 66
66 -
 67
67 -
 68
68 -
 69
69 -
 70
70 -
 71
71 -
 72
72 -
 73
73 -
 74
74 -
 75
75 -
 76
76 -
 77
77 -
 78
78 -
 79
79 -
 80
80 -
 81
81 -
 82
82 -
 83
83 -
84
-
85
-
86
-
87
-
88
-
89
-
90
-
91
-
92
-
93
-
94
-
95
-
96
-
97
-
98
-
99
-
100
-
101
-
102
-
103
-
104
-
105
-
106
-
107
-
108
-
109
-
110
-
111
-
112
-
113
-
114
-
115
-
116
-
117
-
118
-
119
-
120
-
121
-
122
-
123
-
124
-
125
-
126
-
127
-
128
-
129
-
130
-
131
-
132
-
133
-
134
-
135
-
136
-
137
-
138
-
139
-
140
-
141
-
142
-
143
-
144
-
145
-
146
-
147
-
148
-
149
-
150
-
151
-
152
-
153
-
154
-
155
-
156
-
157
-
158
-
159
-
160
-
161
-
162
-
163
-
164
-
165
-
166
-
167
-
168
-
169
-
170
-
171
-
172
-
173
-
174
-
175
-
176
-
177
-
178
-
179
-
180
-
181
-
182
-
183
-
184
-
185
-
186
-
187
-
188
-
189
-
190
-
191
-
192
-
193
-
194
-
195
-
196
-
197
-
198
-
199
-
200
-
201
-
202
-
203
-
204
-
205
-
206
-
207
-
208
-
209
-
210
-
211
-
212
-
213
-
214
-
215
-
216
-
217
-
218
-
219
-
220
-
221
-
222
-
223
-
224
-
225
-
226
-
227
-
228
-
229
-
230
-
231
-
232
-
233
-
234
-
235
-
236
-
237
-
238
-
239
-
240
-
241
-
242
-
243
-
244
-
245
-
246
-
247
-
248
-
249
-
250
-
251
-
252
-
253
-
254
-
255
-
256
-
257
-
258
-
259
-
260
-
261
-
262
-
263
-
264
-
265
-
266
-
267
-
268
-
269
-
270
-
271
-
272
-
273
-
274
-
275
-
276
-
277
-
278
-
279
-
280
-
281
-
282
-
283
-
284
-
285
-
286
-
287
-
288
-
289
-
290
-
291
-
292
-
293
-
294
-
295
-
296
-
297
-
298
-
299
-
300
-
301
-
302
-
303
-
304
-
305
-
306
-
307
-
308
-
309
-
310
-
311
-
312
-
313
-
314
-
315
-
316
-
317
-
318
-
319
-
320
-
321
-
322
-
323
-
324
-
325
-
326
-
327
-
328
-
329
-
330
-
331
-
332
 |
 |

Table of Contents
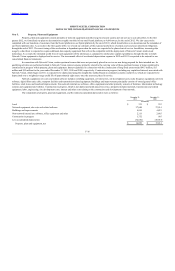
SPRINT NEXTEL CORPORATION
CONSOLIDATED STATEMENTS OF SHAREHOLDERS' EQUITY
(in millions)
See Notes to the Consolidated Financial Statements
F-6
Common Shares
Paid-in Capital
Treasury Shares
Accumulated
Deficit
Accumulated
Other
Comprehensive
Loss Total
Shares(1) Amount Shares Amount
Balance, December 31, 2008 2,951 $ 5,902 $ 47,332 94 $ (1,939)
$ (30,856) $ (524) $ 19,915
Net loss (2,436) (2,436)
Other comprehensive income, net of tax 172 172
Issuance of common shares, net (20) 491 (487) 4
Share-based compensation expense 78 78
Conversion of series 2 to series 1 common shares (40) (80) (785) (40) 865
Equity consideration related to Virgin Mobile
acquisition 96 193 186 379
Other, net (18) 1 (17)
Balance, December 31, 2009 3,007 $ 6,015 $ 46,793 34 $ (582)
$ (33,779) $ (352) $ 18,095
Net loss (3,465) (3,465)
Other comprehensive loss, net of tax (150) (150)
Issuance of common shares, net 1 1 (1) (14) 355 (347) 8
Share-based compensation expense 59 59
Other, net (10) 9 (1)
Balance, December 31, 2010 3,008 $ 6,016 $ 46,841 20 $ (227)
$ (37,582) $ (502) $ 14,546
Net loss (2,890) (2,890)
Other comprehensive loss, net of tax (290) (290)
Issuance of common shares, net 7 14
—
(1) 21 (17) 18
Share-based compensation expense 43 43
Conversion of series 2 to series 1 common shares (19) (38) (168) (19) 206
—
Balance, December 31, 2011 2,996 $ 5,992 $ 46,716
—
$
—
$ (40,489) $ (792) $ 11,427
(1) See note 14 for information regarding common shares.