Sprint - Nextel 2011 Annual Report Download - page 36
Download and view the complete annual report
Please find page 36 of the 2011 Sprint - Nextel annual report below. You can navigate through the pages in the report by either clicking on the pages listed below, or by using the keyword search tool below to find specific information within the annual report.-
 1
1 -
2
-
3
-
4
-
5
-
6
-
7
-
8
-
9
-
10
-
11
-
12
-
13
-
14
-
15
-
16
-
17
-
18
-
19
-
20
-
21
-
22
-
23
-
24
-
25
-
 26
26 -
 27
27 -
 28
28 -
 29
29 -
 30
30 -
 31
31 -
 32
32 -
 33
33 -
 34
34 -
 35
35 -
 36
36 -
 37
37 -
 38
38 -
 39
39 -
 40
40 -
 41
41 -
 42
42 -
 43
43 -
 44
44 -
 45
45 -
 46
46 -
47
-
48
-
49
-
50
-
51
-
52
-
53
-
54
-
55
-
56
-
57
-
58
-
59
-
60
-
61
-
62
-
63
-
64
-
65
-
66
-
67
-
68
-
69
-
70
-
71
-
72
-
73
-
74
-
75
-
76
-
77
-
78
-
79
-
80
-
81
-
82
-
83
-
84
-
85
-
86
-
87
-
88
-
89
-
90
-
91
-
92
-
93
-
94
-
95
-
96
-
97
-
98
-
99
-
100
-
101
-
102
-
103
-
104
-
105
-
106
-
107
-
108
-
109
-
110
-
111
-
112
-
113
-
114
-
115
-
116
-
117
-
118
-
119
-
120
-
121
-
122
-
123
-
124
-
125
-
126
-
127
-
128
-
129
-
130
-
131
-
132
-
133
-
134
-
135
-
136
-
137
-
138
-
139
-
140
-
141
-
142
-
143
-
144
-
145
-
146
-
147
-
148
-
149
-
150
-
151
-
152
-
153
-
154
-
155
-
156
-
157
-
158
-
159
-
160
-
161
-
162
-
163
-
164
-
165
-
166
-
167
-
168
-
169
-
170
-
171
-
172
-
173
-
174
-
175
-
176
-
177
-
178
-
179
-
180
-
181
-
182
-
183
-
184
-
185
-
186
-
187
-
188
-
189
-
190
-
191
-
192
-
193
-
194
-
195
-
196
-
197
-
198
-
199
-
200
-
201
-
202
-
203
-
204
-
205
-
206
-
207
-
208
-
209
-
210
-
211
-
212
-
213
-
214
-
215
-
216
-
217
-
218
-
219
-
220
-
221
-
222
-
223
-
224
-
225
-
226
-
227
-
228
-
229
-
230
-
231
-
232
-
233
-
234
-
235
-
236
-
237
-
238
-
239
-
240
-
241
-
242
-
243
-
244
-
245
-
246
-
247
-
248
-
249
-
250
-
251
-
252
-
253
-
254
-
255
-
256
-
257
-
258
-
259
-
260
-
261
-
262
-
263
-
264
-
265
-
266
-
267
-
268
-
269
-
270
-
271
-
272
-
273
-
274
-
275
-
276
-
277
-
278
-
279
-
280
-
281
-
282
-
283
-
284
-
285
-
286
-
287
-
288
-
289
-
290
-
291
-
292
-
293
-
294
-
295
-
296
-
297
-
298
-
299
-
300
-
301
-
302
-
303
-
304
-
305
-
306
-
307
-
308
-
309
-
310
-
311
-
312
-
313
-
314
-
315
-
316
-
317
-
318
-
319
-
320
-
321
-
322
-
323
-
324
-
325
-
326
-
327
-
328
-
329
-
330
-
331
-
332
 |
 |

Table of Contents
Segment Earnings - Wireless
Wireless segment earnings are primarily a function of wireless service revenue, costs to acquire subscribers, network and interconnection costs to serve those
subscribers and other Wireless segment operating expenses. The costs to acquire our subscribers include the net cost at which we sell our devices, referred to as equipment
net subsidies, as well as the marketing and sales costs incurred to attract those subscribers. Network costs primarily represent switch and cell site costs and interconnection
costs, which generally consist of per-minute usage fees and roaming fees paid to other carriers. The remaining costs associated with operating the Wireless segment
include the costs to operate our customer care organization and administrative support. Wireless service revenue, costs to acquire subscribers, and variable network and
interconnection costs fluctuate with the changes in our subscriber base and their related usage, but some cost elements do not fluctuate in the short term with these
changes.
Wireless segment earnings have declined consecutively for each of the annual periods ending December 31, 2009, 2010 and 2011. Wireless segment earnings
were approximately $4.3 billion, $4.5 billion and $5.2 billion for each of the twelve-month periods ended December 31, 2011, 2010 and 2009, respectively. As discussed
in the section “Effects on our Wireless Business of Postpaid Subscriber Losses”, the Company has significantly reduced the net postpaid subscriber losses occurring since
2009 and increased subscriber net additions within prepaid, wholesale and affiliates. During 2011, the Company entered into a purchase commitment with Apple, Inc. to
purchase a minimum number of smartphones, which on average, is expected to carry a higher subsidy per unit than other smartphones we sell. In addition, during 2012,
we expect to make further progress on Network Vision, including certain costs associated with the ongoing decommissioning efforts of the Nextel platform. As a result,
we expect that wireless segment earnings will decline in 2012 as compared to 2011 until we benefit from Network Vision, through reduced network and operating costs,
and begin to see further increases in retail service revenue through improved total retail postpaid net additions sufficient to recover these increased equipment net subsidy
and acquisition costs.
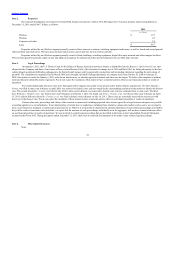
The following table provides an overview of the results of operations of our Wireless segment for each of the three years ended December 31, 2011.
34
Year Ended December 31,
Wireless Earnings 2011 2010 2009
(in millions)
Sprint platform $ 20,052 $ 18,339 $ 18,264
Nextel platform 2,582 3,582 4,941
Total postpaid 22,634 21,921 23,205
Sprint platform 3,325 1,617 358
Nextel platform 1,170 2,139 1,723
Total prepaid 4,495 3,756 2,081
Retail service revenue 27,129 25,677 25,286
Wholesale, affiliate and other revenue 261 217 546
Total service revenue 27,390 25,894 25,832
Cost of services (exclusive of depreciation and amortization) (8,907) (8,288) (8,384)
Service gross margin 18,483 17,606 17,448
Service gross margin percentage 67 % 68 % 68 %
Equipment revenue 2,911 2,703 1,954
Cost of products (8,057) (6,965) (5,545)
Equipment net subsidy (5,146) (4,262) (3,591)
Equipment net subsidy percentage (177)% (158)% (184)%
Selling, general and administrative expense (9,070) (8,813) (8,659)
Wireless segment earnings $4,267
$4,531
$5,198