Sprint - Nextel 2011 Annual Report Download - page 81
Download and view the complete annual report
Please find page 81 of the 2011 Sprint - Nextel annual report below. You can navigate through the pages in the report by either clicking on the pages listed below, or by using the keyword search tool below to find specific information within the annual report.-
 1
1 -
2
-
3
-
4
-
5
-
6
-
7
-
8
-
9
-
10
-
11
-
12
-
13
-
14
-
15
-
16
-
17
-
18
-
19
-
20
-
21
-
22
-
23
-
24
-
25
-
26
-
27
-
28
-
29
-
30
-
31
-
32
-
33
-
34
-
35
-
36
-
37
-
38
-
39
-
40
-
41
-
42
-
43
-
44
-
45
-
46
-
47
-
48
-
49
-
50
-
51
-
52
-
53
-
54
-
55
-
56
-
57
-
58
-
59
-
60
-
61
-
62
-
63
-
64
-
65
-
66
-
67
-
68
-
69
-
70
-
 71
71 -
 72
72 -
 73
73 -
 74
74 -
 75
75 -
 76
76 -
 77
77 -
 78
78 -
 79
79 -
 80
80 -
 81
81 -
 82
82 -
 83
83 -
 84
84 -
 85
85 -
 86
86 -
 87
87 -
 88
88 -
 89
89 -
 90
90 -
 91
91 -
92
-
93
-
94
-
95
-
96
-
97
-
98
-
99
-
100
-
101
-
102
-
103
-
104
-
105
-
106
-
107
-
108
-
109
-
110
-
111
-
112
-
113
-
114
-
115
-
116
-
117
-
118
-
119
-
120
-
121
-
122
-
123
-
124
-
125
-
126
-
127
-
128
-
129
-
130
-
131
-
132
-
133
-
134
-
135
-
136
-
137
-
138
-
139
-
140
-
141
-
142
-
143
-
144
-
145
-
146
-
147
-
148
-
149
-
150
-
151
-
152
-
153
-
154
-
155
-
156
-
157
-
158
-
159
-
160
-
161
-
162
-
163
-
164
-
165
-
166
-
167
-
168
-
169
-
170
-
171
-
172
-
173
-
174
-
175
-
176
-
177
-
178
-
179
-
180
-
181
-
182
-
183
-
184
-
185
-
186
-
187
-
188
-
189
-
190
-
191
-
192
-
193
-
194
-
195
-
196
-
197
-
198
-
199
-
200
-
201
-
202
-
203
-
204
-
205
-
206
-
207
-
208
-
209
-
210
-
211
-
212
-
213
-
214
-
215
-
216
-
217
-
218
-
219
-
220
-
221
-
222
-
223
-
224
-
225
-
226
-
227
-
228
-
229
-
230
-
231
-
232
-
233
-
234
-
235
-
236
-
237
-
238
-
239
-
240
-
241
-
242
-
243
-
244
-
245
-
246
-
247
-
248
-
249
-
250
-
251
-
252
-
253
-
254
-
255
-
256
-
257
-
258
-
259
-
260
-
261
-
262
-
263
-
264
-
265
-
266
-
267
-
268
-
269
-
270
-
271
-
272
-
273
-
274
-
275
-
276
-
277
-
278
-
279
-
280
-
281
-
282
-
283
-
284
-
285
-
286
-
287
-
288
-
289
-
290
-
291
-
292
-
293
-
294
-
295
-
296
-
297
-
298
-
299
-
300
-
301
-
302
-
303
-
304
-
305
-
306
-
307
-
308
-
309
-
310
-
311
-
312
-
313
-
314
-
315
-
316
-
317
-
318
-
319
-
320
-
321
-
322
-
323
-
324
-
325
-
326
-
327
-
328
-
329
-
330
-
331
-
332
 |
 |

Table of Contents
SPRINT NEXTEL CORPORATION
NOTES TO THE CONSOLIDATED FINANCIAL STATEMENTS
On December 13, 2011, Clearwire closed a public equity offering which sold approximately 201.2 million shares of its Class A common stock at a public
offering price of $2.00 per share. In conjunction with the public offering, but in a separate private transaction, Sprint exercised its preemptive rights to purchase
approximately 173.6 million Class B Voting shares and 173.6 million Class B Non-voting shares at an aggregate purchase price of approximately $331 million. These
equity transactions resulted in a dilution of Sprint's non-controlling economic interest and voting interest, and a pre-tax dilution loss of $27 million included in equity in
losses of Clearwire.
Equity in Losses and Summarized Financial Information
Equity in losses from Clearwire were $1.7 billion, $1.3 billion and $803 million for the years ended December 31, 2011, 2010 and 2009, respectively. Sprint's
losses from its investment in Clearwire consist of Sprint's share of Clearwire's net loss and other adjustments such as non-cash impairment of our investment, gains or
losses associated with the dilution of Sprint's ownership interest resulting from Clearwire's equity issuances, and other items recognized by Clearwire Corporation that do
not affect Sprint's economic interest. Sprint's equity in losses from Clearwire for 2011 and 2010 include charges of approximately $361 million and $97 million,
respectively, which are associated with Clearwire's write-off of certain network and other assets that no longer meet their strategic plans. The year ended December 31,
2011 also includes a $135 million pre-tax impairment reflecting Sprint's reduction in the carrying value of its investment in Clearwire to an estimated fair value and a pre-
tax dilution loss of $27 million. Equity in losses of Clearwire for 2009 included a pre-tax dilution loss of $154 million recognized in the first quarter, representing the
finalization of ownership percentages subsequent to the November 2008 formation.
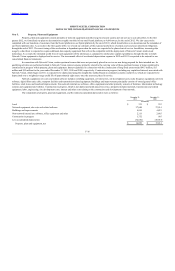
Summarized financial information for Clearwire is as follows:
Sprint's Recoverability
At each financial reporting measurement date, we evaluate the excess, if any, of Sprint's carrying value over the estimated fair value of our investment in
Clearwire to determine if such excess, an implied unrealized loss, is other-than-temporary. Our evaluation considers, among other things, both observable and
unobservable inputs, including Clearwire's market capitalization, including historical volatility associated with Clearwire's common stock, the duration of a decline in
Clearwire's average trading stock price below Sprint's carrying value, potential tax benefits and governance rights associated with our Class B Non-Voting interests, and
our expectation of the duration of our ongoing relationship, as well as other factors. Based on our evaluation as of December 31, 2011, we recognized a non-cash
impairment of $135 million in the fourth quarter 2011 to reflect a reduction to our best
F-14
December 31,
2011 2010
(in millions)
Current assets $ 1,287 $ 1,858
Noncurrent assets 7,556 9,182
Current liabilities $280 $675
Noncurrent liabilities 4,917 4,495
Year Ended December 31,
2011 2010 2009
(in millions)
Revenues $ 1,254 $ 535 $ 244
Operating expenses (3,645) (2,698) (1,384)
Operating loss $ (2,391) $ (2,163) $ (1,140)
Net loss from continuing operations before non-controlling interests $ (2,856) $ (2,251) $ (1,209)
Net loss from discontinued operations before non-controlling interests $ (82) $ (52) $ (45)