Symantec 2012 Annual Report Download - page 117
Download and view the complete annual report
Please find page 117 of the 2012 Symantec annual report below. You can navigate through the pages in the report by either clicking on the pages listed below, or by using the keyword search tool below to find specific information within the annual report.-
 1
1 -
2
-
3
-
4
-
5
-
6
-
7
-
8
-
9
-
10
-
11
-
12
-
13
-
14
-
15
-
16
-
17
-
18
-
19
-
20
-
21
-
22
-
23
-
24
-
25
-
26
-
27
-
28
-
29
-
30
-
31
-
32
-
33
-
34
-
35
-
36
-
37
-
38
-
39
-
40
-
41
-
42
-
43
-
44
-
45
-
46
-
47
-
48
-
49
-
50
-
51
-
52
-
53
-
54
-
55
-
56
-
57
-
58
-
59
-
60
-
61
-
62
-
63
-
64
-
65
-
66
-
67
-
68
-
69
-
70
-
71
-
72
-
73
-
74
-
75
-
76
-
77
-
78
-
79
-
80
-
81
-
82
-
83
-
84
-
85
-
86
-
87
-
88
-
89
-
90
-
91
-
92
-
93
-
94
-
95
-
96
-
97
-
98
-
99
-
100
-
101
-
102
-
103
-
104
-
105
-
106
-
 107
107 -
 108
108 -
 109
109 -
 110
110 -
 111
111 -
 112
112 -
 113
113 -
 114
114 -
 115
115 -
 116
116 -
 117
117 -
 118
118 -
 119
119 -
 120
120 -
 121
121 -
 122
122 -
 123
123 -
 124
124 -
 125
125 -
 126
126 -
 127
127 -
128
-
129
-
130
-
131
-
132
-
133
-
134
-
135
-
136
-
137
-
138
-
139
-
140
-
141
-
142
-
143
-
144
-
145
-
146
-
147
-
148
-
149
-
150
-
151
-
152
-
153
-
154
-
155
-
156
-
157
-
158
-
159
-
160
-
161
-
162
-
163
-
164
-
165
-
166
-
167
-
168
-
169
-
170
-
171
-
172
-
173
-
174
-
175
-
176
-
177
-
178
-
179
-
180
-
181
-
182
-
183
-
184
-
185
-
186
-
187
-
188
 |
 |

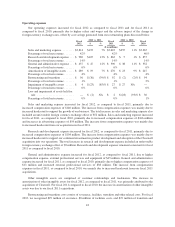
Net revenue and operating income by segment
Consumer segment
2012 vs. 2011 2011 vs. 2010
Fiscal
2012 $ %
Fiscal
2011 $ %
Fiscal
2010
($ in millions)
Consumer revenue ........................... $2,104 $151 8% $1,953 $82 4% $1,871
Percentage of total net revenue ................. 31% 32% 31%
Consumer operating income ................... $1,013 $114 13% $ 899 $39 5% $ 860
Percentage of Consumer revenue ............... 48% 46% 46%
Consumer revenue increased for fiscal 2012, as compared to fiscal 2011, primarily due to continued growth
in our premium internet and security products of $156 million, which included a favorable foreign currency
exchange effect of $39 million. Of the total Consumer revenue recognized in fiscal 2012, 86% was generated
from our electronic channel sales, which are derived from online sales (including new subscriptions, renewals
and upgrades).
Consumer revenue increased for fiscal 2011, as compared to fiscal 2010, primarily due to an increase in
sales of our premium internet and security products of $91 million, which included an unfavorable foreign
currency exchange effect of $10 million. Of the total Consumer revenue recognized in fiscal 2011, 84% was
generated from our electronic channel sales, which are derived from online sales (including new subscriptions,
renewals and upgrades).
Consumer operating income increased for fiscal 2012, as compared to fiscal 2011, primarily due to higher
revenue of $151 million and lower advertising and promotion expenses of $22 million, partially offset by
increased salaries and wages of $41 million and higher cost of revenue of $17 million. The increased salaries and
wages expense was due to higher headcount compared to fiscal 2011. The increase in cost of revenue was
primarily associated with the increased product revenue. The increase in operating income included a favorable
foreign currency exchange effect of $28 million.
Consumer operating income increased for fiscal 2011, as compared to fiscal 2010, primarily due to
increased revenue of $83 million, partially offset by increases in advertising and promotion expenses of $22
million, equipment costs of $11 million, and costs associated with the deployment of our new proprietary
eCommerce platform. The increase in operating income included an unfavorable foreign currency exchange
effect of $7 million.
Security and Compliance segment
2012 vs. 2011 2011 vs. 2010
Fiscal
2012 $ %
Fiscal
2011 $ %
Fiscal
2010
($ in millions)
Security and Compliance revenue ............. $1,965 $327 20% $1,638 $ 156 11% $1,482
Percentage of total net revenue ............... 29% 26% 25%
Security and Compliance operating income ..... $ 442 $182 70% $ 260 $(141) (35)% $ 401
Percentage of Security and Compliance
revenue ................................ 22% 16% 27%
Security and Compliance revenue increased for fiscal 2012, as compared to fiscal 2011, primarily due to
increased sales of our information security products of $300 million, which included additional revenue of
approximately $238 million from our user authentication and trust products and services. The total increase
included a favorable foreign currency exchange effect of $43 million.
38