Symantec 2012 Annual Report Download - page 6
Download and view the complete annual report
Please find page 6 of the 2012 Symantec annual report below. You can navigate through the pages in the report by either clicking on the pages listed below, or by using the keyword search tool below to find specific information within the annual report.-
 1
1 -
 2
2 -
 3
3 -
 4
4 -
 5
5 -
 6
6 -
 7
7 -
 8
8 -
 9
9 -
 10
10 -
 11
11 -
 12
12 -
 13
13 -
 14
14 -
 15
15 -
 16
16 -
 17
17 -
18
-
19
-
20
-
21
-
22
-
23
-
24
-
25
-
26
-
27
-
28
-
29
-
30
-
31
-
32
-
33
-
34
-
35
-
36
-
37
-
38
-
39
-
40
-
41
-
42
-
43
-
44
-
45
-
46
-
47
-
48
-
49
-
50
-
51
-
52
-
53
-
54
-
55
-
56
-
57
-
58
-
59
-
60
-
61
-
62
-
63
-
64
-
65
-
66
-
67
-
68
-
69
-
70
-
71
-
72
-
73
-
74
-
75
-
76
-
77
-
78
-
79
-
80
-
81
-
82
-
83
-
84
-
85
-
86
-
87
-
88
-
89
-
90
-
91
-
92
-
93
-
94
-
95
-
96
-
97
-
98
-
99
-
100
-
101
-
102
-
103
-
104
-
105
-
106
-
107
-
108
-
109
-
110
-
111
-
112
-
113
-
114
-
115
-
116
-
117
-
118
-
119
-
120
-
121
-
122
-
123
-
124
-
125
-
126
-
127
-
128
-
129
-
130
-
131
-
132
-
133
-
134
-
135
-
136
-
137
-
138
-
139
-
140
-
141
-
142
-
143
-
144
-
145
-
146
-
147
-
148
-
149
-
150
-
151
-
152
-
153
-
154
-
155
-
156
-
157
-
158
-
159
-
160
-
161
-
162
-
163
-
164
-
165
-
166
-
167
-
168
-
169
-
170
-
171
-
172
-
173
-
174
-
175
-
176
-
177
-
178
-
179
-
180
-
181
-
182
-
183
-
184
-
185
-
186
-
187
-
188
 |
 |

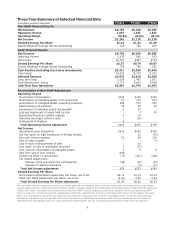
Three Year Summary of Selected Financial Data
($ in millions, except per share data) FY2012 FY2011 FY2010
Non-GAAP Financial Results
Net Revenue $6,730 $6,190 $5,985
Operating Income 1,697 1,535 1,692
Operating Margin 25.2% 24.8% 28.3%
Net Income $1,201 $1,119 $1,220
Diluted Earnings Per Share $1.61 $1.42 $1.49
Diluted Weighted-Average Shares Outstanding 748 786 819
GAAP Financial Results
Net Revenue $6,730 $6,190 $5,985
Operating Income 1,079 880 933
Net Income $1,172 $597 $714
Diluted Earnings Per Share $1.57 $0.76 $0.87
Diluted Weighted-Average Shares Outstanding 748 786 819
Cash Position (including short-term investments) $3,211 $2,958 $3,044
Total Assets 13,020 12,719 11,232
Deferred Revenue $3,973 $3,819 $3,206
Long-Term Debt 2,039 1,987 1,871
Total Stockholders’ Equity 5,172 4,605 4,548
Cash Flow from Operations $1,901 $1,794 $1,693
Reconciliation of Non-GAAP Adjustments
Operating Income
Stock-based compensation $164 $145 $155
Amortization of intangible assets (cost of revenue) 91 115 233
Amortization of intangible assets (operating expenses) 289 270 247
Restructuring and transition 56 92 94
Impairment of intangible assets and goodwill 4 27 -
Loss and impairment of assets held for sale - 2 30
Acquisition/divestiture-related expense 6 14 -
Internally developed software costs - (10) -
Settlements of litigation 8--
Total Operating Income adjustment $618 $655 $759
Net Income
Operating Income adjustment $618 $655 $759
Net loss (gain) on legal liquidations of foreign entities - 21 (43)
Non-cash interest expense 56 96 105
Gain on sale of assets - - (4)
Loss on early extinguishment of debt - 16 -
Loss (gain) on sale of marketable securities 1 (13) -
Joint venture: Amortization of intangible assets 4 9 8
Gain from sale of joint venture (526) - -
Income tax effect on above items (76) (221) (246)
Tax related adjustments:
Release of pre-acquisition tax contingencies (48) (32) (62)
Release of valuation allowance - (9) (11)
Total Net Income adjustment $29 $522 $506
Diluted Earnings Per Share
Stock-based compensation adjustment per share, net of tax $0.16 $0.14 $0.14
Other non-GAAP adjustments per share, net of tax (0.12) 0.52 0.48
Total Diluted Earnings Per Share adjustment $0.04 $0.66 $0.62
The non-GAAP financial measures included in the tables adjust for the following items: business combination accounting entries, stock-based
compensation expense, restructuring and transition charges, charges related to the amortization of intangible assets, impairments of assets and
certain other items. We believe the presentation of these non-GAAP financial measures, when taken together with the corresponding GAAP
financial measures, provides meaningful supplemental information regarding the Company’s operating performance for the reasons discussed
below. Our management uses these non-GAAP financial measures in assessing the Company’s operating results, as well as when planning,
forecasting and analyzing future periods. We believe that these non-GAAP financial measures also facilitate comparisons of the Company’s
performance to prior periods and to our peers and that investors benefit from an understanding of these non-GAAP financial measures.
4