Symantec 2012 Annual Report Download - page 120
Download and view the complete annual report
Please find page 120 of the 2012 Symantec annual report below. You can navigate through the pages in the report by either clicking on the pages listed below, or by using the keyword search tool below to find specific information within the annual report.-
 1
1 -
2
-
3
-
4
-
5
-
6
-
7
-
8
-
9
-
10
-
11
-
12
-
13
-
14
-
15
-
16
-
17
-
18
-
19
-
20
-
21
-
22
-
23
-
24
-
25
-
26
-
27
-
28
-
29
-
30
-
31
-
32
-
33
-
34
-
35
-
36
-
37
-
38
-
39
-
40
-
41
-
42
-
43
-
44
-
45
-
46
-
47
-
48
-
49
-
50
-
51
-
52
-
53
-
54
-
55
-
56
-
57
-
58
-
59
-
60
-
61
-
62
-
63
-
64
-
65
-
66
-
67
-
68
-
69
-
70
-
71
-
72
-
73
-
74
-
75
-
76
-
77
-
78
-
79
-
80
-
81
-
82
-
83
-
84
-
85
-
86
-
87
-
88
-
89
-
90
-
91
-
92
-
93
-
94
-
95
-
96
-
97
-
98
-
99
-
100
-
101
-
102
-
103
-
104
-
105
-
106
-
107
-
108
-
109
-
 110
110 -
 111
111 -
 112
112 -
 113
113 -
 114
114 -
 115
115 -
 116
116 -
 117
117 -
 118
118 -
 119
119 -
 120
120 -
 121
121 -
 122
122 -
 123
123 -
 124
124 -
 125
125 -
 126
126 -
 127
127 -
 128
128 -
 129
129 -
 130
130 -
131
-
132
-
133
-
134
-
135
-
136
-
137
-
138
-
139
-
140
-
141
-
142
-
143
-
144
-
145
-
146
-
147
-
148
-
149
-
150
-
151
-
152
-
153
-
154
-
155
-
156
-
157
-
158
-
159
-
160
-
161
-
162
-
163
-
164
-
165
-
166
-
167
-
168
-
169
-
170
-
171
-
172
-
173
-
174
-
175
-
176
-
177
-
178
-
179
-
180
-
181
-
182
-
183
-
184
-
185
-
186
-
187
-
188
 |
 |

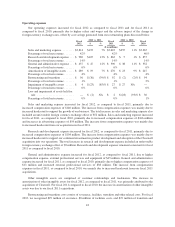
Net revenue by geographic region
Fiscal
2012
2012 vs. 2011 Fiscal
2011
2011 vs. 2010 Fiscal
2010$ % $ %
($ in millions)
Americas (U.S., Canada and Latin America)
Consumer Segment .......................... $1,206 $ 72 6% $1,134 $ 90 9% $1,044
Security and Compliance Segment .............. 1,044 134 15% 910 81 10% 829
Storage and Server Management Segment ........ 1,240 40 3% 1,200 (5) 0% 1,205
Services Segment ........................... 135 (9) (6)% 144 (19) (12)% 163
Total Americas ............................... $3,625 $237 7% $3,388 $147 5% $3,241
Percentage of total net revenue ................. 54% 55% 54%
EMEA (Europe, Middle East, Africa)
Consumer Segment .......................... $ 545 $ 42 8% $ 503 $(35) (7)% $ 538
Security and Compliance Segment .............. 527 72 16% 455 24 6% 431
Storage and Server Management Segment ........ 723 6 1% 717 (21) (3)% 738
Services Segment ........................... 63 (35) (36)% 98 (33) (25)% 131
Total EMEA ................................. $1,858 $ 85 5% $1,773 $ (65) (4)% $1,838
Percentage of total net revenue ................. 28% 29% 31%
Asia Pacific/Japan
Consumer Segment .......................... $ 353 $ 36 11% $ 317 $ 28 10% $ 289
Security and Compliance Segment .............. 394 121 44% 273 51 23% 222
Storage and Server Management Segment ........ 447 57 15% 390 46 13% 344
Services Segment ........................... 53 4 8% 49 (2) (4)% 51
Total Asia Pacific/ Japan ....................... $1,247 $218 21% $1,029 $123 14% $ 906
Percentage of total net revenue ................. 18% 16% 15%
Total net revenue ............................. $6,730 $540 9% $6,190 $205 3% $5,985
Fluctuations in the U.S. dollar compared to foreign currencies favorably impacted our international revenue
by approximately $145 million for fiscal 2012 as compared to fiscal 2011. For fiscal 2011 as compared 2010, we
had an unfavorable foreign currency exchange effect of $53 million. Our international revenue is and will
continue to be a significant portion of our net revenue. As a result, net revenue will continue to be affected by
foreign currency exchange rates as compared to the U.S. dollar.
Cost of revenue
Fiscal
2012
2012 vs. 2011 Fiscal
2011
2011 vs. 2010 Fiscal
2010$ % $ %
($ in millions)
Cost of content, subscription, and
maintenance ................... $ 943 $40 4% $ 903 $ 54 6% $ 849
Percentage of related revenue ...... 16% 17% 17%
Cost of license .................... $ 48 $21 78% $ 27 $ 5 23% $ 22
Percentage of related revenue ...... 5% 3% 2%
Amortization of intangible assets ..... $ 91 $(24) (21)% $ 115 $(119) (51)% $ 234
Percentage of total net revenue ..... 1% 2% 4%
Total cost of revenue ........... $1,082 $ 37 4% $1,045 $ (60) (5)% $1,105
Gross margin ................. 84% 83% 82%
41