Symantec 2012 Annual Report Download - page 119
Download and view the complete annual report
Please find page 119 of the 2012 Symantec annual report below. You can navigate through the pages in the report by either clicking on the pages listed below, or by using the keyword search tool below to find specific information within the annual report.-
 1
1 -
2
-
3
-
4
-
5
-
6
-
7
-
8
-
9
-
10
-
11
-
12
-
13
-
14
-
15
-
16
-
17
-
18
-
19
-
20
-
21
-
22
-
23
-
24
-
25
-
26
-
27
-
28
-
29
-
30
-
31
-
32
-
33
-
34
-
35
-
36
-
37
-
38
-
39
-
40
-
41
-
42
-
43
-
44
-
45
-
46
-
47
-
48
-
49
-
50
-
51
-
52
-
53
-
54
-
55
-
56
-
57
-
58
-
59
-
60
-
61
-
62
-
63
-
64
-
65
-
66
-
67
-
68
-
69
-
70
-
71
-
72
-
73
-
74
-
75
-
76
-
77
-
78
-
79
-
80
-
81
-
82
-
83
-
84
-
85
-
86
-
87
-
88
-
89
-
90
-
91
-
92
-
93
-
94
-
95
-
96
-
97
-
98
-
99
-
100
-
101
-
102
-
103
-
104
-
105
-
106
-
107
-
108
-
 109
109 -
 110
110 -
 111
111 -
 112
112 -
 113
113 -
 114
114 -
 115
115 -
 116
116 -
 117
117 -
 118
118 -
 119
119 -
 120
120 -
 121
121 -
 122
122 -
 123
123 -
 124
124 -
 125
125 -
 126
126 -
 127
127 -
 128
128 -
 129
129 -
130
-
131
-
132
-
133
-
134
-
135
-
136
-
137
-
138
-
139
-
140
-
141
-
142
-
143
-
144
-
145
-
146
-
147
-
148
-
149
-
150
-
151
-
152
-
153
-
154
-
155
-
156
-
157
-
158
-
159
-
160
-
161
-
162
-
163
-
164
-
165
-
166
-
167
-
168
-
169
-
170
-
171
-
172
-
173
-
174
-
175
-
176
-
177
-
178
-
179
-
180
-
181
-
182
-
183
-
184
-
185
-
186
-
187
-
188
 |
 |

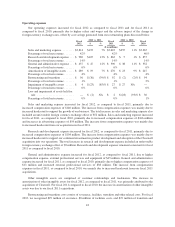
Services segment
Fiscal
2012
2012 vs. 2011 Fiscal
2011
2011 vs. 2010 Fiscal
2010$ % $ %
($ in millions)
Services revenue .............................. $251 $(41) (14)% $292 $(53) (15)% $345
Percentage of total net revenue ................... 4% 5% 6%
Services operating income ....................... $ 39 $32 457% $ 7 $ (5) (42)% $ 12
Percentage of Services revenue ................... 16% 2% 3%
We transitioned certain consulting services to specialized partners while we focus on our core software
business. This resulted in decreased revenue for fiscal 2012 as compared to fiscal 2011. Services operating
income increased for fiscal 2012, as compared to fiscal 2011, due to lower cost of revenue and salaries and wages
as we transitioned certain consulting services to our partner led consulting program.
Services revenue and operating income decreased for fiscal 2011, as compared to fiscal 2010, due to our
focus on our core software business.
Other segment
Fiscal
2012
2012 vs. 2011 Fiscal
2011
2011 vs. 2010 Fiscal
2010$ % $ %
($ in millions)
Other revenue .......................... $ — $— NA $ — $— NA $ —
Percentage of total net revenue ............. 0% 0% 0%
Other operating loss ..................... $(1,392) $(43) 3% $(1,349) $88 * $(1,437)
Percentage of Other revenue ............... * * *
* Percentage not meaningful
Our Other segment consists primarily of sunset products and products nearing the end of their life cycle.
The operating loss of our Other segment includes general and administrative expenses; amortization of acquired
intangible and other assets; charges such as stock-based compensation; restructuring and transition expenses; and
certain indirect costs that are not charged to the other operating segments.
40