Symantec 2012 Annual Report Download - page 118
Download and view the complete annual report
Please find page 118 of the 2012 Symantec annual report below. You can navigate through the pages in the report by either clicking on the pages listed below, or by using the keyword search tool below to find specific information within the annual report.-
 1
1 -
2
-
3
-
4
-
5
-
6
-
7
-
8
-
9
-
10
-
11
-
12
-
13
-
14
-
15
-
16
-
17
-
18
-
19
-
20
-
21
-
22
-
23
-
24
-
25
-
26
-
27
-
28
-
29
-
30
-
31
-
32
-
33
-
34
-
35
-
36
-
37
-
38
-
39
-
40
-
41
-
42
-
43
-
44
-
45
-
46
-
47
-
48
-
49
-
50
-
51
-
52
-
53
-
54
-
55
-
56
-
57
-
58
-
59
-
60
-
61
-
62
-
63
-
64
-
65
-
66
-
67
-
68
-
69
-
70
-
71
-
72
-
73
-
74
-
75
-
76
-
77
-
78
-
79
-
80
-
81
-
82
-
83
-
84
-
85
-
86
-
87
-
88
-
89
-
90
-
91
-
92
-
93
-
94
-
95
-
96
-
97
-
98
-
99
-
100
-
101
-
102
-
103
-
104
-
105
-
106
-
107
-
 108
108 -
 109
109 -
 110
110 -
 111
111 -
 112
112 -
 113
113 -
 114
114 -
 115
115 -
 116
116 -
 117
117 -
 118
118 -
 119
119 -
 120
120 -
 121
121 -
 122
122 -
 123
123 -
 124
124 -
 125
125 -
 126
126 -
 127
127 -
 128
128 -
129
-
130
-
131
-
132
-
133
-
134
-
135
-
136
-
137
-
138
-
139
-
140
-
141
-
142
-
143
-
144
-
145
-
146
-
147
-
148
-
149
-
150
-
151
-
152
-
153
-
154
-
155
-
156
-
157
-
158
-
159
-
160
-
161
-
162
-
163
-
164
-
165
-
166
-
167
-
168
-
169
-
170
-
171
-
172
-
173
-
174
-
175
-
176
-
177
-
178
-
179
-
180
-
181
-
182
-
183
-
184
-
185
-
186
-
187
-
188
 |
 |

Security and Compliance revenue increased for fiscal 2011, as compared to fiscal 2010, primarily due to
increased sales of our information security products of $209 million, which included additional revenue of $124
million from our user authentication and trust products. The increase was partially offset by decreases in
enterprise security products revenue by $68 million. The total increase included an unfavorable foreign currency
exchange effect of $5 million.
Security and Compliance operating income increased for fiscal 2012, as compared to fiscal 2011, primarily
due to increased revenue of $327 million, partially offset by increased salaries and wages of $71 million and
higher cost of revenue of $54 million. The increased salaries and wages expense was due to higher headcount
compared to fiscal 2011. The higher cost of revenue was associated with revenue growth. The increase in
operating income included a favorable foreign currency exchange effect of $23 million.
Security and Compliance operating income decreased for fiscal 2011, as compared to fiscal 2010, primarily
due to expenses related to our fiscal 2011 acquisitions and higher sales commissions associated with the increase
in deferred revenue in fiscal 2011. Our operating margins were adversely impacted by our fiscal 2011
acquisitions, largely because we were required under the purchase accounting rules to reduce the amount of
deferred revenue that we recorded in connection with these acquisitions to an amount equal to the fair value of
our estimated cost to fulfill the contractual obligations related to that deferred revenue. This deferred revenue
adjustment negatively affected our operating margins because we recognized a lower portion of the revenue from
these acquisitions, but we incurred all of the revenue-related expenses. The decrease in operating income
included an unfavorable foreign currency exchange effect of $11 million.
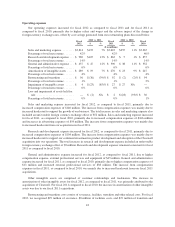
Storage and Server Management segment
2012 vs. 2011 2011 vs. 2010
Fiscal
2012 $ %
Fiscal
2011 $ %
Fiscal
2010
($ in millions)
Storage and Server Management revenue ......... $2,410 $103 4% $2,307 $ 20 1% $2,287
Percentage of total net revenue ................. 36% 37% 38%
Storage and Server Management operating
income .................................. $ 977 $(86) (8)% $1,063 $(34) (3)% $1,097
Percentage of Storage and Server Management
revenue .................................. 41% 46% 48%
Storage and Server Management revenue increased for fiscal 2012, as compared to fiscal 2011, primarily
due to higher sales of our information management products of $126 million, which included $49 million from
our fiscal 2012 acquisition of Clearwell Systems Inc. (“Clearwell”), partially offset by decreases in sales of $28
million of our storage management products. The total increase included a favorable foreign currency exchange
effect of $52 million.
Storage and Server Management revenue increased for fiscal 2011, as compared to fiscal 2010, primarily
due to higher sales of our information management products of $94 million, partially offset by lower sales of our
storage management products of $67 million. The total increase included an unfavorable foreign currency
exchange effect of $33 million.
Storage and Server Management operating income decreased for fiscal 2012, as compared to fiscal 2011,
primarily due to higher salaries and wages of $139 million and higher cost of revenue of $59 million, partially
offset by the increase in overall revenue. The increased salaries and wages expense was due to increased
headcount over fiscal 2011, which was attributable to our Clearwell acquisition and growth in the business. The
total decrease in operating income included a favorable foreign currency exchange effect of $48 million.
Storage and Server Management operating income decreased for fiscal 2011, as compared to fiscal 2010,
primarily due to an unfavorable foreign currency exchange effect of $35 million.
39