Symantec 2012 Annual Report Download - page 122
Download and view the complete annual report
Please find page 122 of the 2012 Symantec annual report below. You can navigate through the pages in the report by either clicking on the pages listed below, or by using the keyword search tool below to find specific information within the annual report.-
 1
1 -
2
-
3
-
4
-
5
-
6
-
7
-
8
-
9
-
10
-
11
-
12
-
13
-
14
-
15
-
16
-
17
-
18
-
19
-
20
-
21
-
22
-
23
-
24
-
25
-
26
-
27
-
28
-
29
-
30
-
31
-
32
-
33
-
34
-
35
-
36
-
37
-
38
-
39
-
40
-
41
-
42
-
43
-
44
-
45
-
46
-
47
-
48
-
49
-
50
-
51
-
52
-
53
-
54
-
55
-
56
-
57
-
58
-
59
-
60
-
61
-
62
-
63
-
64
-
65
-
66
-
67
-
68
-
69
-
70
-
71
-
72
-
73
-
74
-
75
-
76
-
77
-
78
-
79
-
80
-
81
-
82
-
83
-
84
-
85
-
86
-
87
-
88
-
89
-
90
-
91
-
92
-
93
-
94
-
95
-
96
-
97
-
98
-
99
-
100
-
101
-
102
-
103
-
104
-
105
-
106
-
107
-
108
-
109
-
110
-
111
-
 112
112 -
 113
113 -
 114
114 -
 115
115 -
 116
116 -
 117
117 -
 118
118 -
 119
119 -
 120
120 -
 121
121 -
 122
122 -
 123
123 -
 124
124 -
 125
125 -
 126
126 -
 127
127 -
 128
128 -
 129
129 -
 130
130 -
 131
131 -
 132
132 -
133
-
134
-
135
-
136
-
137
-
138
-
139
-
140
-
141
-
142
-
143
-
144
-
145
-
146
-
147
-
148
-
149
-
150
-
151
-
152
-
153
-
154
-
155
-
156
-
157
-
158
-
159
-
160
-
161
-
162
-
163
-
164
-
165
-
166
-
167
-
168
-
169
-
170
-
171
-
172
-
173
-
174
-
175
-
176
-
177
-
178
-
179
-
180
-
181
-
182
-
183
-
184
-
185
-
186
-
187
-
188
 |
 |

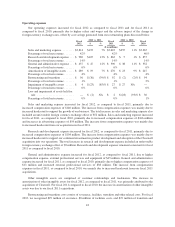
Operating expenses
Our operating expenses increased for fiscal 2012 as compared to fiscal 2011 and for fiscal 2011 as
compared to fiscal 2010, primarily due to higher salary and wages and the adverse impact of the change in
foreign currency exchange rates, offset by cost savings generated from our restructuring plans discussed below.
Fiscal
2012
2012 vs. 2011 Fiscal
2011
2011 vs. 2010 Fiscal
2010$ % $ %
($ in millions)
Sales and marketing expense ........ $2,814 $192 7% $2,622 $255 11% $2,367
Percentage of total net revenue ....... 42% 42% 40%
Research and development expense . . . $ 969 $107 12% $ 862 $ 5 1% $ 857
Percentage of total net revenue ....... 14% 14% 14%
General and administrative expense . . . $ 437 $ 47 12% $ 390 $ 38 11% $ 352
Percentage of total net revenue ....... 6% 6% 6%
Amortization of intangible assets ..... $ 289 $ 19 7% $ 270 $ 23 9% $ 247
Percentage of total net revenue ....... 4% 4% 4%
Restructuring and transition ......... $ 56 $(36) (39)% $ 92 $ (2) (2)% $ 94
Percentage of total net revenue ....... 1% 1% 2%
Impairment of intangible assets ...... $ 4 $(23) (85)% $ 27 $ 27 NA —
Percentage of total net revenue ....... 0% 0% 0%
Loss and impairment of assets held for
sale .......................... — $ (2) NA $ 2 $(28) (93)% $ 30
Percentage of total net revenue ....... 0% 0% 1%
Sales and marketing expense increased for fiscal 2012, as compared to fiscal 2011, primarily due to
increased compensation expenses of $140 million. The increase from compensation expenses was mainly due to
increased headcount to support the growth of our business. The total increase in sales and marketing expense also
included an unfavorable foreign currency exchange effect of $52 million. Sales and marketing expense increased
for fiscal 2011, as compared to fiscal 2010, primarily due to increased compensation expenses of $166 million
and increases in advertising expenses of $54 million. The increase from compensation expenses was mainly due
to increased headcount from our acquisitions in fiscal 2011.
Research and development expense increased for fiscal 2012, as compared to fiscal 2011, primarily due to
increased compensation expenses of $104 million. The increase from compensation expenses was mainly due to
increased headcount to support our continued investment in product development and absorption of the Clearwell
acquisition into our operations. The total increase in research and development expense included an unfavorable
foreign currency exchange effect of $9 million. Research and development expense remained consistent for fiscal
2011 as compared to fiscal 2010.
General and administrative expense increased for fiscal 2012, as compared to fiscal 2011, due to higher
compensation expense, external professional services and equipment of $45 million. General and administrative
expense increased for fiscal 2011, as compared to fiscal 2010, primarily due to higher compensation expenses of
$11 million and increased external professional services of $38 million. The increase from compensation
expenses in fiscal 2011, as compared to fiscal 2010, was mainly due to increased headcount from our fiscal 2011
acquisitions.
Other intangible assets are comprised of customer relationships and tradenames. The increase in
amortization of other intangible assets for fiscal 2012, as compared to fiscal 2011, was primarily attributed to the
acquisition of Clearwell. For fiscal 2011 compared to fiscal 2010, the increase in amortization of other intangible
assets was due to our fiscal 2011 acquisitions.
Restructuring and transition costs consist of severance, facilities, transition and other related costs. For fiscal
2012, we recognized $29 million of severance, $8 million of facilities costs, and $19 million of transition and
43