Target 2005 Annual Report Download - page 18
Download and view the complete annual report
Please find page 18 of the 2005 Target annual report below. You can navigate through the pages in the report by either clicking on the pages listed below, or by using the keyword search tool below to find specific information within the annual report.-
 1
1 -
2
-
3
-
4
-
5
-
6
-
7
-
 8
8 -
 9
9 -
 10
10 -
 11
11 -
 12
12 -
 13
13 -
 14
14 -
 15
15 -
 16
16 -
 17
17 -
 18
18 -
 19
19 -
 20
20 -
 21
21 -
 22
22 -
 23
23 -
 24
24 -
 25
25 -
 26
26 -
 27
27 -
 28
28 -
29
-
30
-
31
-
32
-
33
-
34
-
35
-
36
-
37
-
38
-
39
-
40
-
41
-
42
-
43
-
44
-
45
-
46
 |
 |

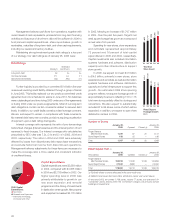
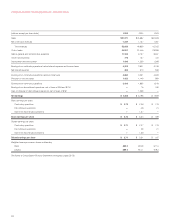
16
2005 2004 2003 2002 2001 2000
Financial Results: (in millions)
Sales $51,271 $45,682 $40,928 $36,519 $32,602 $29,462
Net credit card revenues 1,349 1,157 1,097 891 419 278
Total revenues 52,620 46,839 42,025 37,410 33,021 29,740
Cost of sales 34,927 31,445 28,389 25,498 23,030 20,870
Selling, general and administrative expenses (a) 11,185 9,797 8,657 7,505 6,612 6,025
Credit card expenses 776 737 722 629 313 185
Depreciation and amortization 1,409 1,259 1,098 967 820 676
Earnings before interest expense and income taxes (b) 4,323 3,601 3,159 2,811 2,246 1,984
Net interest expense 463 570 556 584 470 422
Earnings before income taxes 3,860 3,031 2,603 2,227 1,776 1,562
Provision for income taxes 1,452 1,146 984 851 675 600
Earnings from continuing operations $ 2,408 $ 1,885 $ 1,619 $ 1,376 $ 1,101 $ 962
Per Share:
Basic earnings per share $2.73 $ 2.09 $ 1.78 $ 1.52 $ 1.22 $ 1.06
Diluted earnings per share $2.71 $ 2.07 $ 1.76 $ 1.51 $ 1.21 $ 1.06
Cash dividends declared $ .380 $ .310 $ .270 $ .240 $ .225 $ .215
Financial Position: (in millions)
Total assets $34,995 $32,293 $27,390 $24,506 $19,808 $15,349
Capital expenditures $ 3,388 $ 3,068 $ 2,738 $ 3,040 $ 3,002 $ 2,319
Long-term debt $ 9,119 $ 9,034 $10,155 $10,119 $ 8,055 $ 5,598
Net debt (c) $ 8,700 $ 7,806 $10,774 $10,733 $ 8,873 $ 6,453
Shareholders’ investment $14,205 $13,029 $11,132 $ 9,497 $ 7,896 $ 6,548
Financial Ratios:
Revenues per square foot (d)(e) $ 307 $ 294 $ 287 $ 281 $ 277 $ 272
Comparable-store sales growth (e) 5.6% 5.3% 4.4% 2.2% 4.1% 3.4%
Gross margin rate (% of sales) 31.9% 31.2% 30.6% 30.2% 29.4% 29.2%
SG&A rate (% of sales) 21.8% 21.4% 21.2% 20.5% 20.3% 20.5%
EBIT margin (% of revenue) 8.2% 7.7% 7.5% 7.5% 6.8% 6.7%
Other:
Common shares outstanding (in millions) 874.1 890.6 911.8 909.8 905.2 897.8
Retail square feet (in thousands) 178,260 165,015 152,563 140,294 125,359 113,060
Square footage growth 8.0% 8.2% 8.8% 11.9% 10.9% 9.4%
Total number of stores 1,397 1,308 1,225 1,147 1,053 977
General Merchandise 1,239 1,172 1,107 1,053 991 947
SuperTarget 158 136 118 94 62 30
Total number of distribution centers 26 25 22 16 14 12
(a) Also referred to as SG&A.
(b) Also referred to as EBIT.
(c) Including current portion and notes payable, net of marketable securities of $1,172, $1,732, $244, $357 and $84, respectively. There were no marketable securities in 2000.
Management believes this measure is a more appropriate indicator of our level of financial leverage because marketable securities are available to pay debt maturity obligations.
(d) Thirteen-month average retail square feet.
(e) In 2000, a 53 week year, revenues per square foot and comparable-store sales growth are calculated with 52 weeks of revenues because management believes that
these numbers provide a more useful analytical comparison to other years. Under generally accepted accounting principles (GAAP), revenues per square foot were $276
and comparable-store sales growth was 5.1 percent. In 2001, comparable-store sales increased 2.4 percent from the 53 week base period.
FINANCIAL SUMMARY – CONTINUING OPERATIONS