Target 2005 Annual Report Download - page 19
Download and view the complete annual report
Please find page 19 of the 2005 Target annual report below. You can navigate through the pages in the report by either clicking on the pages listed below, or by using the keyword search tool below to find specific information within the annual report.-
 1
1 -
2
-
3
-
4
-
5
-
6
-
7
-
8
-
 9
9 -
 10
10 -
 11
11 -
 12
12 -
 13
13 -
 14
14 -
 15
15 -
 16
16 -
 17
17 -
 18
18 -
 19
19 -
 20
20 -
 21
21 -
 22
22 -
 23
23 -
 24
24 -
 25
25 -
 26
26 -
 27
27 -
 28
28 -
 29
29 -
30
-
31
-
32
-
33
-
34
-
35
-
36
-
37
-
38
-
39
-
40
-
41
-
42
-
43
-
44
-
45
-
46
 |
 |

17
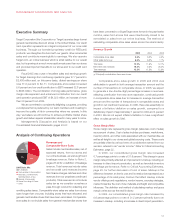
Executive Summary
Target Corporation (the Corporation or Target) operates large-format
general merchandise discount stores in the United States. Our credit
card operation represents an integral component of our core retail
business. Through our branded proprietary credit (or REDcard)
products, we strengthen the bond with our guests, drive incremental
sales and contribute meaningfully to earnings. We also operate
Target.com, an online business which is small relative to our overall
size, but is growing at a much more rapid annual pace than our stores
and provides important benefits to our stores and to our credit card
operation.
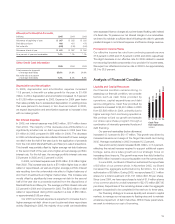
Fiscal 2005 was a year of excellent sales and earnings growth
for Target. Earnings from continuing operations grew 27.7 percent to
$2,408 million and, on this same basis, diluted earnings per share
rose 31.0 percent to $2.71. Comparable-store sales increased
5.6 percent and our credit contribution to EBIT increased 32.8 percent
to $645 million. The combination of strong sales performance, gross
margin rate expansion and enhanced contribution from our credit
card operation produced EBIT of $4,323 million, an increase of more
than 20 percent from 2004.
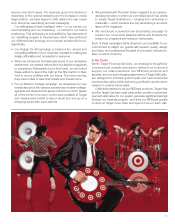
We are committed to consistently delighting our guests, providing
a workplace that is preferred by our team members and investing to
improve the quality of life in communities where we operate. In this
way, we believe we will continue to achieve profitable market share
growth and deliver superior shareholder value for many years to come.
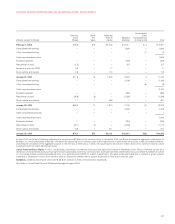
Management’s Discussion and Analysis is based on our
Consolidated Financial Statements, pages 24-27.
Analysis of Continuing Operations
Revenues and
Comparable-Store Sales
Sales include merchandise sales, net of
expected returns, from our stores and
our online business, as well as gift card
breakage revenue. Refer to Note 2,
pages 28-29 for a definition of breakage
revenue. Total revenues include sales
and net credit card revenues (income
from finance charges, late fees and other
revenues from our proprietary credit card
products). Total revenues do not include
sales tax as we consider ourselves a
pass-through conduit for collecting and
remitting sales taxes. Comparable-store sales are sales from stores
open longer than one year, including stores that have relocated and
general merchandise stores that have been remodeled. Comparable-
store sales do not include sales from general merchandise stores that
have been converted to a SuperTarget store format in the past twelve
months, sales from stores that were intentionally closed to be
remodeled or sales from our online business. The method of
calculating comparable-store sales varies across the retail industry.
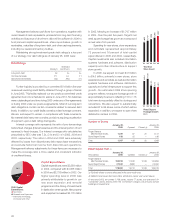
Revenue Growth
2005 2004 2003
Comparable-store sales 5.6% 5.3% 4.4%
Other sales factors (a) 6.6% 6.3% 7.7%
Total sales 12.2% 11.6% 12.1%
Net credit card revenues 16.5% 5.5% 23.2%
Total revenues 12.3% 11.5% 12.3%
(a) Principally contributions from new stores.
Comparable-store sales growth in 2005 and 2004 was
attributable to growth in both average transaction amount and the
number of transactions in comparable stores. In 2006, we expect
to generate a low-double-digit percentage increase in revenues,
reflecting contribution from new store expansion, continued growth
in comparable-store sales due to increases in average transaction
amount and the number of transactions in comparable stores and
growth in net credit card revenues. In 2005, there was essentially no
impact of inflation/deflation on sales growth, compared to a
deflationary impact of approximately 1 percent in 2004 and 4 percent
in 2003. We do not expect inflation/ deflation to have a significant
effect on sales growth in 2006.
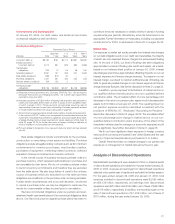
Gross Margin Rate
Gross margin rate represents gross margin (sales less cost of sales)
as a percent of sales. Cost of sales includes purchases, markdowns,
inventory shrink, and other costs associated with our merchandise, as
well as all freight to our stores and global sourcing costs. These costs
are partially offset by various forms of consideration earned from our
vendors, referred to as “vendor income.” Refer to Critical Accounting
Estimates, page 22.
In 2005, our consolidated gross margin rate increased
0.7 percentage points to a rate of 31.9 percent. This change in gross
margin rate primarily reflected an improvement in markup, including an
increase in direct import penetration, as well as favorable inventory
shrinkage performance. Refer to Critical Accounting Estimates,
page 22, for further discussion of cost of sales. Markup is the
difference between an item’s cost and its retail price (expressed as a
percentage of its retail price). Factors that affect markup include
vendor offerings and negotiations, vendor income, sourcing strategies,
market forces like the cost of raw materials and freight and competitive
influences. The definition and method of calculating markup and gross
margin varies across the retail industry.
In 2004, our consolidated gross margin rate increased by
0.6 percentage points to a rate of 31.2 percent primarily due to an
increase in markup, including an increase in direct import penetration.
MANAGEMENT’S DISCUSSION AND ANALYSIS
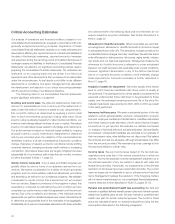
2005 Sales Mix
($51.3 billion)
• Consumables & Commodities
• Electronics, Entertainment,
• Sporting Goods & Toys
• Apparel & Accessories
• Home Furnishings & Décor
• Other
23%
20%
5%
30%
22%