Target 2005 Annual Report Download - page 20
Download and view the complete annual report
Please find page 20 of the 2005 Target annual report below. You can navigate through the pages in the report by either clicking on the pages listed below, or by using the keyword search tool below to find specific information within the annual report.-
 1
1 -
2
-
3
-
4
-
5
-
6
-
7
-
8
-
9
-
 10
10 -
 11
11 -
 12
12 -
 13
13 -
 14
14 -
 15
15 -
 16
16 -
 17
17 -
 18
18 -
 19
19 -
 20
20 -
 21
21 -
 22
22 -
 23
23 -
 24
24 -
 25
25 -
 26
26 -
 27
27 -
 28
28 -
 29
29 -
 30
30 -
31
-
32
-
33
-
34
-
35
-
36
-
37
-
38
-
39
-
40
-
41
-
42
-
43
-
44
-
45
-
46
 |
 |

18
We expect our consolidated gross margin rate in 2006 to be
approximately equal to our 2005 rate as potential opportunities to
increase gross margin are expected to approximately offset potential
pressures. The factors affecting our outlook include: our introduction
of new merchandising strategies, our growth in direct imports and
our ability to leverage our increasing scale, offset by the competitive
pricing environment and the more rapid pace of growth of lower
margin categories, like consumables and commodities.
Selling, General and Administrative Expense Rate
Our SG&A expense rate represents payroll, benefits, advertising,
distribution, buying and occupancy, start-up and other expenses as
a percentage of sales. SG&A expenses exclude depreciation and
amortization and expenses associated with our credit card operation,
which are reflected separately in our Consolidated Statements of
Operations. In 2005, 2004 and 2003 approximately $110 million,
$72 million and $58 million, respectively, of vendor income was recorded
as an offset to SG&A expenses because it represented reimbursement
for specific, incremental and identifiable advertising costs.
In 2005, our consolidated SG&A expense rate increased to
21.8 percent compared to 21.4 percent in 2004. The expense rate
increase was due to several factors, including the year-over-year
impact of reduced transition services income related to our 2004
divestitures of Marshall Field’s and Mervyn’s, higher utilities expense
and the effects of stronger year-over-year performance on incentive
and share-based compensation expense. Some of the expense rate
increase can also be attributed to growth in marketing expenses for
which the corresponding vendor income is recorded as a reduction of
inventory costs because it did not meet the criteria required for
recording it as an element of SG&A expenses. The combination of
all unfavorable expense items more than offset the year-over-year
favorability from last year’s lease accounting adjustment.
In 2004, our consolidated SG&A expense rate rose to
21.4 percent compared to 21.2 percent in 2003. Approximately half
of this year-over-year increase was attributable to a lease expense
adjustment that synchronized our straight-line expense term with the
depreciable lives of the associated assets. See further discussion in
Note 29, page 39. The primary driver of the remaining increase was
higher workers’ compensation costs.
In 2006, we expect our SG&A expense rate to be approximately
equal to our 2005 rate.
Credit Card Contribution
We offer credit to qualified guests through our REDcard products,
including the Target Visa and Target Card. Our credit card revenues
are finance charges, late fees and other revenues. In addition, we
receive third-party merchant fees from merchants who accept the
Target Visa credit card. In 2005 and 2004, our net credit card revenues
increased due to continued growth in the Target Visa portfolio. In 2005,
growth in net credit card revenues was also attributable to higher
interest rates, as a majority of our receivables are assessed finance
charges at a prime-based floating rate. Credit card expenses include
a bad debt provision, as well as operations and marketing expenses
supporting our credit card portfolio. In 2005 versus 2004, our bad
debt provision grew at a slower pace than our average receivables
balance due to the aging of the portfolio and the favorable macro-
economic credit card environment. However, our total reserve balance
as a percentage of average receivables increased in 2005 as we
reserve for the expected effects of the mandated increases in
minimum payments for certain guests. Our net write-offs as a
percentage of average receivables and our delinquency rates
continued to improve, despite a significant increase in bankruptcy
filings in advance of the October 2005 effective date of the related
federal bankruptcy legislation. Operations and marketing expenses
increased primarily due to the growth of the Target Visa portfolio.
The contribution from our credit card operation to EBIT includes
finance charge revenue, late fees, other revenue, intracompany and
third party merchant fees, less bad debt provision and operations
and marketing expenses.
We expect our 2006 credit card receivables to grow in line with
2006 sales, and we expect our overall credit card performance to
remain strong. The improvement in our delinquency rates is not
expected to continue throughout 2006 as we cycle the effects of the
October 2005 bankruptcy legislation and experience the effects of
the mandated increases in minimum payments for certain guests.
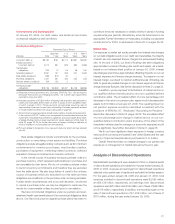
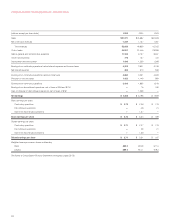
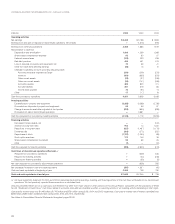
Credit Card Contribution to EBIT
(millions) 2005 2004 2003
Revenues:
Finance charges, late fees
and other revenues $1,225 $1,059 $1,015
Merchant fees
Intracompany 72 65 49
Third-party 124 98 82
Total revenues 1,421 1,222 1,146
Expenses:
Bad debt provision 466 451 476
Operations and marketing 310 286 246
Total expenses 776 737 722
Pre-tax credit card contribution to EBIT $ 645 $ 485 $ 424
As a percent of average receivables 11.6% 9.8% 9.1%
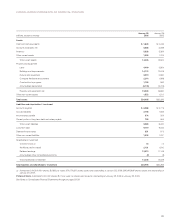
Receivables
(millions) 2005 2004 2003
Year-end receivables $6,117 $5,456 $4,973
Average receivables $5,544 $4,927 $4,661
Accounts with three or more
payments past due as a percent
of year-end receivables 2.8% 3.5% 4.2%