Target 2005 Annual Report Download - page 31
Download and view the complete annual report
Please find page 31 of the 2005 Target annual report below. You can navigate through the pages in the report by either clicking on the pages listed below, or by using the keyword search tool below to find specific information within the annual report.-
 1
1 -
2
-
3
-
4
-
5
-
6
-
7
-
8
-
9
-
10
-
11
-
12
-
13
-
14
-
15
-
16
-
17
-
18
-
19
-
20
-
 21
21 -
 22
22 -
 23
23 -
 24
24 -
 25
25 -
 26
26 -
 27
27 -
 28
28 -
 29
29 -
 30
30 -
 31
31 -
 32
32 -
 33
33 -
 34
34 -
 35
35 -
 36
36 -
 37
37 -
 38
38 -
 39
39 -
 40
40 -
 41
41 -
42
-
43
-
44
-
45
-
46
 |
 |

29
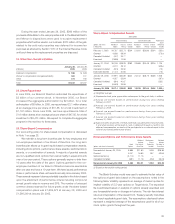
Net credit card revenues are recognized according to the
contractual provisions of each applicable credit card agreement. If
an account is written-off, any uncollected finance charges or late fees
are recorded as a reduction of net credit card revenues. Target retail
store sales charged to our credit cards totaled $3,655 million, $3,269
million and $3,006 million in 2005, 2004 and 2003, respectively.
3. Cost of Sales and Selling, General and
Administrative (SG&A) Expenses
The following illustrates the primary costs classified in each major
expense category:
The methodology behind the classification of expenses varies across the retail industry.
4. Consideration Received from Vendors
We receive consideration for a variety of vendor-sponsored programs,
such as volume rebates, markdown allowances, promotions and
advertising and for our compliance programs, referred to as “vendor
income.” Vendor income reduces either our inventory costs or SG&A
expenses based on application of EITF Issue No. 02-16, “Accounting
by a Customer (Including a Reseller) for Certain Consideration
Received from a Vendor,” as amended by EITF Issue No. 03-10,
“Application of Issue 02-16 by Resellers to Sales Incentives Offered to
Consumers by Manufacturers.” Promotional and advertising
allowances are intended to offset our costs of promoting and selling
the vendor’s merchandise in our stores. Under our compliance
programs, vendors are charged for merchandise shipments that do
not meet our requirements (“violations”), such as late or incomplete
shipments. These allowances are recorded when violations occur.
5. Advertising Costs
Advertising costs are expensed at first showing of the advertisement
and were $1,028 million, $888 million and $872 million for 2005, 2004
and 2003, respectively. Advertising vendor income that offset
advertising expenses was approximately $110 million, $72 million and
$58 million for 2005, 2004 and 2003, respectively. Newspaper
circulars and media broadcast made up the majority of our advertising
costs in all three years.
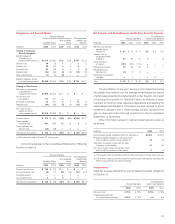
6. Discontinued Operations
We completed the sale of our Marshall Field’s and Mervyn’s
businesses during 2004. In accordance with SFAS No. 144,
“Accounting for the Impairment or Disposal of Long-Lived Assets,”
the financial results of Marshall Field’s and Mervyn’s are reported as
discontinued operations.
No financial results of discontinued operations are included for
the year ended January 28, 2006. For the years ended January 29,
2005 and January 31, 2004, total revenues included in discontinued
operations were $3,095 million and $6,138 million, respectively, and
earnings from discontinued operations were $75 million and
$190 million, net of taxes of $46 million and $116 million, respectively.
In addition, we recorded a gain on the sale of discontinued operations
of $1,238 million, net of taxes of $761 million, during the year ended
January 29, 2005.
There were no assets or liabilities of Marshall Field’s or Mervyn’s
included in our Consolidated Statements of Financial Position at
January 28, 2006 or January 29, 2005.
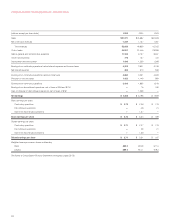
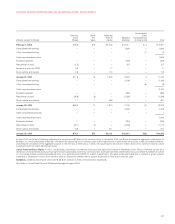
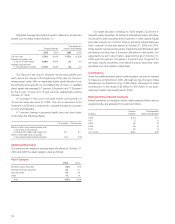
7. Earnings per Share
Basic earnings per share (EPS) is net earnings divided by the average
number of common shares outstanding during the period. Diluted EPS
includes the incremental shares assumed to be issued on the exercise
of stock options and the potentially issuable performance shares.
Basic EPS Diluted EPS
(millions, except
per share data) 2005 2004 2003 2005 2004 2003
Net earnings $2,408 $3,198 $1,809 $2,408 $3,198 $1,809
Basic weighted
average
common shares
outstanding 882.0 903.8 911.0 882.0 903.8 911.0
Stock options and
performance shares ———7.2 8.3 8.2
Weighted average
common shares
outstanding 882.0 903.8 911.0 889.2 912.1 919.2
Earnings per share $ 2.73 $ 3.54 $ 1.99 $ 2.71 $ 3.51 $ 1.97
Our diluted EPS calculation excludes any shares related to stock options for which
the effect would have been antidilutive. There were no material antidilutive shares
issuable upon exercise excluded from the dilutive EPS calculations at January 28,
2006, January 29, 2005 and January 31, 2004, respectively.
8. Other Comprehensive Income/ (Loss)
Other comprehensive income/ (loss) includes revenues, expenses,
gains and losses that are excluded from net earnings under GAAP
and are recorded directly to shareholders’ investment. In 2005, 2004
and 2003, other comprehensive income/ (loss) primarily included gains
and losses on certain hedge transactions and the change in our
minimum pension liability, net of related taxes.
Cost of Sales
Total cost of products sold including:
• Freight expenses associated with
moving merchandise from our
vendors to our distribution centers
and our retail stores
• Vendor income that is not
reimbursement of specific,
incremental and identifiable costs
Inventory shrink
Markdowns
Shipping and handling expenses
Terms cash discount
SG&A Expenses
Payroll and benefit costs
Occupancy and operating
costs of retail, distribution,
and corporate facilities
Advertising offset by vendor income
that is a reimbursement of specific,
incremental and identifiable costs
Other administrative costs