Target 2005 Annual Report Download - page 40
Download and view the complete annual report
Please find page 40 of the 2005 Target annual report below. You can navigate through the pages in the report by either clicking on the pages listed below, or by using the keyword search tool below to find specific information within the annual report.-
 1
1 -
2
-
3
-
4
-
5
-
6
-
7
-
8
-
9
-
10
-
11
-
12
-
13
-
14
-
15
-
16
-
17
-
18
-
19
-
20
-
21
-
22
-
23
-
24
-
25
-
26
-
27
-
28
-
29
-
 30
30 -
 31
31 -
 32
32 -
 33
33 -
 34
34 -
 35
35 -
 36
36 -
 37
37 -
 38
38 -
 39
39 -
 40
40 -
 41
41 -
 42
42 -
 43
43 -
 44
44 -
 45
45 -
 46
46
 |
 |

38
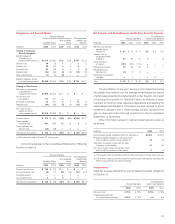
Weighted average assumptions used to determine net periodic
benefit cost for years ended October 31:
Postretirement
Pension Benefits Health Care Benefits
2005 2004 2005 2004
Discount rate 5.75% 6.25% 5.75% 6.25%
Expected long-term rate
of return on plan assets 8.00% 8.00% n/a n/a
Average assumed rate
of compensation increase 2.75% 3.25% n/a n/a
The discount rate used to measure net periodic benefit cost
each year is the rate as of the beginning of the year (i.e. the prior
measurement date). With an essentially stable asset allocation over
the following time periods, our annualized rate of return on qualified
plans’ assets has averaged 5.1 percent, 9.9 percent and 11.5 percent
for the 5-year, 10-year and 15-year periods, respectively, ending
October 31, 2005.
An increase in the cost of covered health care benefits of
10 percent was assumed for 2005. The rate is assumed to be
9 percent in 2006 and is reduced by 1 percent annually to 5 percent
in 2010 and thereafter.
A 1 percent change in assumed health care cost trend rates
would have the following effects:
1% Increase 1% Decrease
Effect on total of service and interest cost
components of net periodic
postretirement health care benefit cost $— $—
Effect on the health care component
of the postretirement benefit obligation $ 5 $ (4)
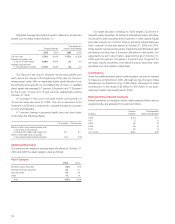
Additional Information
Our pension plan weighted average asset allocations at October 31,
2005 and 2004 by asset category were as follows:
Asset Category
2005 2004
Domestic equity securities 36% 37%
International equity securities 20 21
Debt securities 26 26
Other 18 16
Total 100% 100%
Our asset allocation strategy for 2006 targets 35 percent in
domestic equity securities, 20 percent in international equity securities,
25 percent in debt securities and 20 percent in other assets. Equity
securities include our common stock in amounts substantially less
than 1 percent of total plan assets at October 31, 2005 and 2004.
Other assets include private equity, mezzanine and distressed debt
and timber and less than a 5 percent allocation to real estate. Our
expected long-term rate of return assumptions as of October 31,
2005 were 8.5 percent, 8.5 percent, 5 percent and 10 percent for
domestic equity securities, international equity securities, debt
securities and other assets, respectively.
Contributions
Given the qualified pension plan’s funded position, we are not required
to make any contributions in 2006, although we may choose to make
discretionary contributions of up to $80 million. We expect to make
contributions in the range of $5 million to $15 million to our post-
retirement health care benefit plan in 2006.
Estimated Future Benefit Payments
Benefit payments by the plans, which reflect expected future service
as appropriate, are expected to be paid as follows:
Pension Postretirement
(millions) Benefits Health Care Benefits
2006 $ 64 $11
2007 72 12
2008 80 13
2009 86 13
2010 90 14
2011–2015 $540 $79