Target 2005 Annual Report Download - page 22
Download and view the complete annual report
Please find page 22 of the 2005 Target annual report below. You can navigate through the pages in the report by either clicking on the pages listed below, or by using the keyword search tool below to find specific information within the annual report.-
 1
1 -
2
-
3
-
4
-
5
-
6
-
7
-
8
-
9
-
10
-
11
-
 12
12 -
 13
13 -
 14
14 -
 15
15 -
 16
16 -
 17
17 -
 18
18 -
 19
19 -
 20
20 -
 21
21 -
 22
22 -
 23
23 -
 24
24 -
 25
25 -
 26
26 -
 27
27 -
 28
28 -
 29
29 -
 30
30 -
 31
31 -
 32
32 -
33
-
34
-
35
-
36
-
37
-
38
-
39
-
40
-
41
-
42
-
43
-
44
-
45
-
46
 |
 |
20
Management believes cash flows from operations, together with
current levels of cash equivalents, proceeds from long-term financing
activities and issuance of short-term debt will be sufficient in 2006 to
fund planned capital expenditures, share repurchases, growth in
receivables, maturities of long-term debt, and other cash requirements,
including our seasonal inventory buildup.
Maintaining strong investment-grade debt ratings is a key part
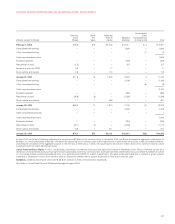
of our strategy. Our debt ratings as of January 28, 2006 were:
Debt Ratings
Standard
Moody’s and Poor’s Fitch
Long-term debt A2 A+ A+
Commercial paper P-1 A-1 F1
Securitized receivables Aaa AAA n/a
Further liquidity is provided by a committed $1.6 billion five-year
unsecured revolving credit facility obtained through a group of banks
in June 2005. This facility replaced our two previous committed credit
agreements and is scheduled to expire in June 2010. No balances
were outstanding at any time during 2005 under any of the agreements
or during 2004 under our previous agreements. Most of our long-term
debt obligations contain certain covenants related to secured debt
levels. In addition, our credit facility contains a debt leverage covenant.
We are, and expect to remain, in compliance with these covenants.
No material debt instrument contains provisions requiring acceleration
of payment upon a debt rating downgrade.
Interest coverage ratio represents the ratio of pre-tax earnings
before fixed charges (interest expense and the interest portion of rent
expense) to fixed charges. Our interest coverage ratio calculated as
prescribed by SEC rules was 7.2x, 5.4x and 5.1x in 2005, 2004 and
2003, respectively. The ratios in 2004 and 2003 were adversely
affected by losses from discretionary debt repurchase transactions
and exclude historical income from discontinued operations.
Management believes adjustments for these items are necessary to
make the coverage ratio a more useful and consistent indicator
of creditworthiness.
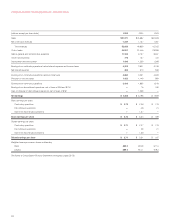
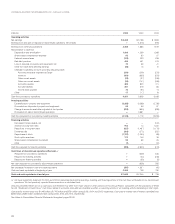
Capital Expenditures
Capital expenditures were $3,388 million
in 2005, compared with $3,068 million
in 2004 and $2,738 million in 2003. Our
higher spending level in 2005 was
primarily attributable to growth in our
new store expansion and remodel
programs and the timing of investments
in distribution center growth. Net property
and equipment increased $2,178 million
in 2005, following an increase of $1,707 million
in 2004. Over the past five years, Target’s net
retail square footage has grown at a compound
annual rate of 9.5 percent.
Spending for new stores, store expansions
and remodels represented approximately
72 percent and 76 percent of total capital
expenditures in 2005 and 2004, respectively.
Capital investments also included information
systems hardware and software, distribution
capacity and other infrastructure to support
store growth.
In 2006, we expect to invest $3.8 billion
to $4.0 billion, primarily in new stores, store
expansions and remodels, as well as information
systems hardware and software, distribution
capacity and other infrastructure to support this
growth. Our estimated 2006 store opening
program reflects net square footage growth of
approximately 8 percent, reflecting 110 to 115
total new stores partially offset by closings and
relocations. We also expect to substantially
remodel 60 to 65 stores, some of which will be
expanded. In addition, we expect to open three
distribution centers in 2006.
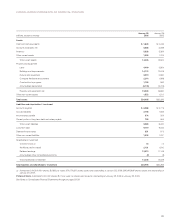
Number of Stores
January 28, January 29,
2006 Opened Closed (a) 2005
Target General
Merchandise Stores 1,239 87 20 1,172
SuperTarget Stores 158 22 — 136
Total 1,397 109 20 1,308
Retail Square Feet (b)
January 28, January 29,
(thousands) 2006 Opened Closed (a) 2005
Target General
Merchandise Stores 150,318 11,530 2,165 140,953
SuperTarget Stores 27,942 3,880 — 24,062
Total 178,260 15,410 2,165 165,015
(a) Typically relates to stores relocated in the same trade area.
(b) Reflects total square feet, less office, distribution center and vacant space.
At year-end 2005, we owned 1,166 stores, leased 77 stores and operated 154
“combined” stores. Stores within the “combined” category are primarily owned
buildings on leased land.
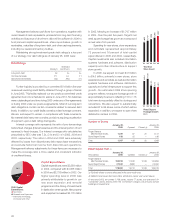
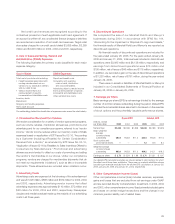
2005 Capital
Expenditures
• New Stores
• Remodels and Expansions
• Information Technology,
• Distribution and Other
60%
12%
28%
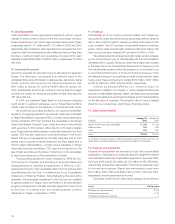
’01 ’02 ’03’04
1,053
1,147
1,225
1,308
Year-End
Store Count
’05
1,397
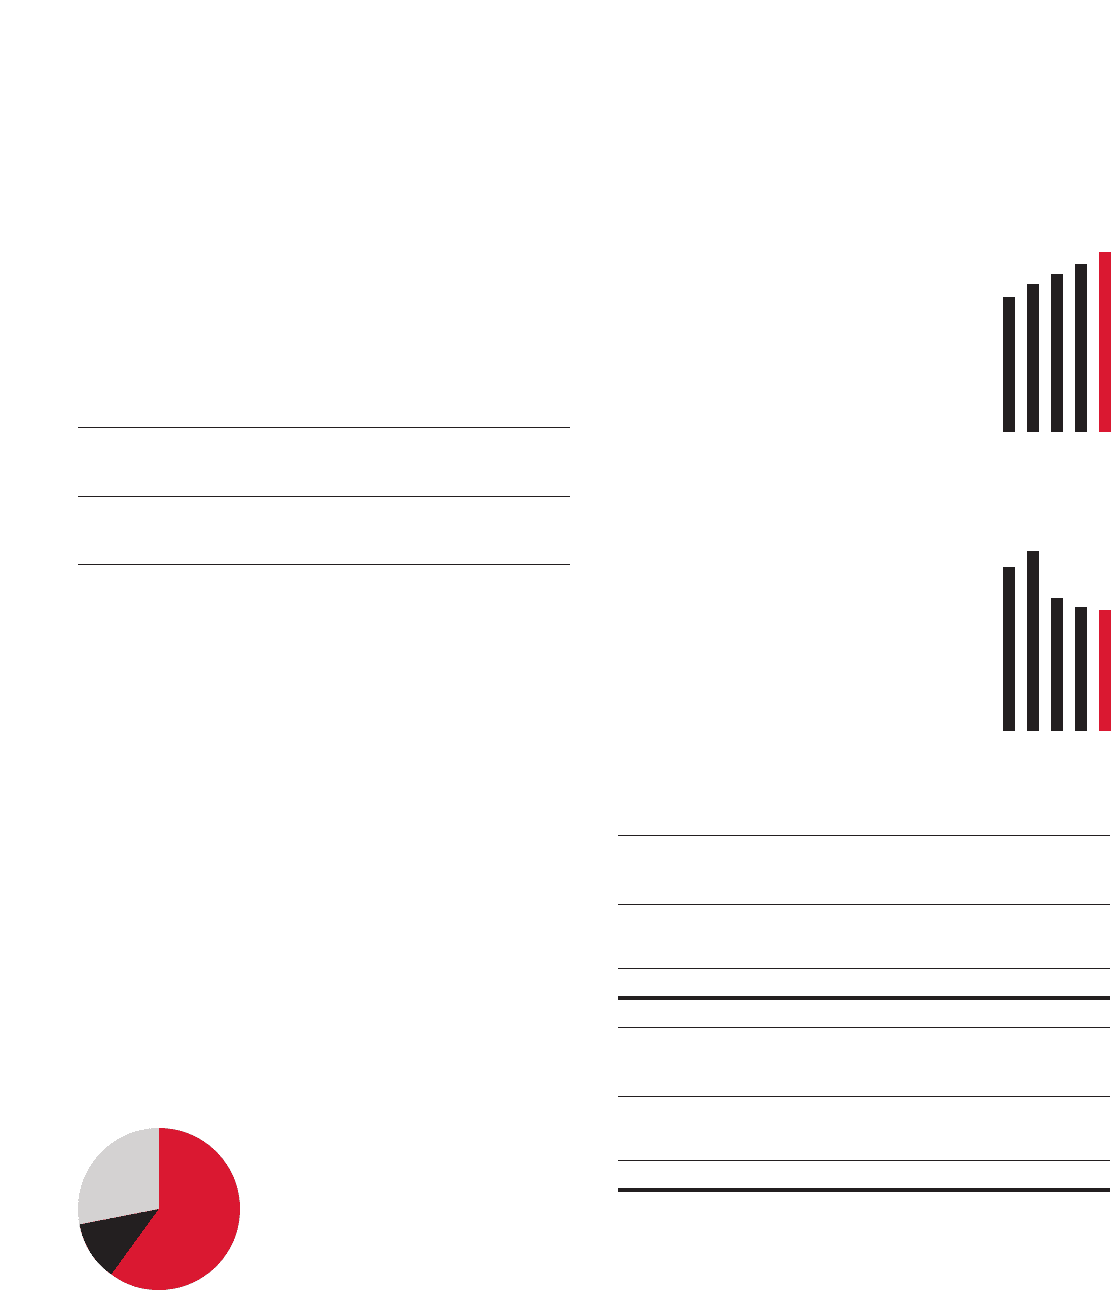
’01 ’02 ’03’04
10.9%
11.9%
8.8%
8.2%
Retail Square
Footage Growth
(Net)
’05
8.0%