Target 2005 Annual Report Download - page 28
Download and view the complete annual report
Please find page 28 of the 2005 Target annual report below. You can navigate through the pages in the report by either clicking on the pages listed below, or by using the keyword search tool below to find specific information within the annual report.-
 1
1 -
2
-
3
-
4
-
5
-
6
-
7
-
8
-
9
-
10
-
11
-
12
-
13
-
14
-
15
-
16
-
17
-
 18
18 -
 19
19 -
 20
20 -
 21
21 -
 22
22 -
 23
23 -
 24
24 -
 25
25 -
 26
26 -
 27
27 -
 28
28 -
 29
29 -
 30
30 -
 31
31 -
 32
32 -
 33
33 -
 34
34 -
 35
35 -
 36
36 -
 37
37 -
 38
38 -
39
-
40
-
41
-
42
-
43
-
44
-
45
-
46
 |
 |

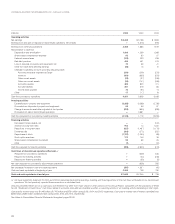
26
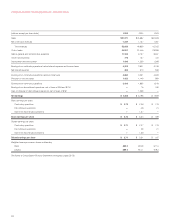
(millions) 2005 2004 2003
Operating activities
Net earnings $ 2,408 $ 3,198 $ 1,809
Earnings from and gain on disposal of discontinued operations, net of taxes —(1,313) (190)
Earnings from continuing operations 2,408 1,885 1,619
Reconciliation to cash flow
Depreciation and amortization 1,409 1,259 1,098
Share-based compensation expense 93 60 57
Deferred income taxes (122) 233 208
Bad debt provision 466 451 476
Loss on disposal of property and equipment, net 70 59 41
Other non-cash items affecting earnings (50) 73 10
Changes in operating accounts providing/(requiring) cash:
Accounts receivable originated at Target (244) (209) (279)
Inventory (454) (853) (579)
Other current assets (28) (37) (196)
Other non-current assets (24) (147) (166)
Accounts payable 489 823 721
Accrued liabilities 351 319 85
Income taxes payable 70 (91) 74
Other 17 (17) 19
Cash flow provided by operations 4,451 3,808 3,188
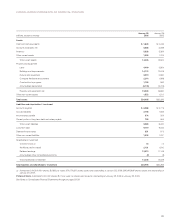
Investing activities
Expenditures for property and equipment (3,388) (3,068) (2,738)
Proceeds from disposals of property and equipment 58 56 67
Change in accounts receivable originated at third parties (819) (690) (538)
Proceeds from sale of discontinued operations —4,881 —
Cash flow (required for)/ provided by investing activities (4,149) 1,179 (3,209)
Financing activities
Decrease in notes payable, net —— (100)
Additions to long-term debt 913 10 1,200
Reductions of long-term debt (527) (1,487) (1,179)
Dividends paid (318) (272) (237)
Repurchase of stock (1,197) (1,290) (48)
Stock option exercises 172 146 36
Share-based compensation tax benefit 59 69 25
Other (1) — (10)
Cash flow required for financing activities (899) (2,824) (313)
Cash flows of discontinued operations (Revised) (a)
(Required for)/provided by operations —(549) 545
Required for investing activities —(44) (248)
Required for financing activities —(33) (5)
Net cash (required for)/ provided by discontinued operations —(626) 292
Net (decrease)/increase in cash and cash equivalents (597) 1,537 (42)
Cash and cash equivalents at beginning of year 2,245 708 750
Cash and cash equivalents at end of year $ 1,648 $ 2,245 $ 708
(a) We have revised this statement for 2004 and 2003 to separately disclose the operating, investing and financing portions of the cash flows attributable to our discontinued
operations. We had previously reported these amounts on a combined basis.
Amounts presented herein are on a cash basis and therefore may differ from those shown in other sections of this Annual Report. Consistent with the provisions of SFAS
No. 95, “Statement of Cash Flows,” cash flows related to accounts receivable are classified as either an operating activity or an investing activity, depending on their origin.
Cash paid for income taxes was $1,448 million, $1,742 million and $781 million during 2005, 2004 and 2003, respectively. Cash paid for interest (net of interest capitalized) was
$468 million, $480 million and $542 million during 2005, 2004 and 2003, respectively.
See Notes to Consolidated Financial Statements throughout pages 28-39.
CONSOLIDATED STATEMENTS OF CASH FLOWS