Target 2005 Annual Report Download - page 21
Download and view the complete annual report
Please find page 21 of the 2005 Target annual report below. You can navigate through the pages in the report by either clicking on the pages listed below, or by using the keyword search tool below to find specific information within the annual report.-
 1
1 -
2
-
3
-
4
-
5
-
6
-
7
-
8
-
9
-
10
-
 11
11 -
 12
12 -
 13
13 -
 14
14 -
 15
15 -
 16
16 -
 17
17 -
 18
18 -
 19
19 -
 20
20 -
 21
21 -
 22
22 -
 23
23 -
 24
24 -
 25
25 -
 26
26 -
 27
27 -
 28
28 -
 29
29 -
 30
30 -
 31
31 -
32
-
33
-
34
-
35
-
36
-
37
-
38
-
39
-
40
-
41
-
42
-
43
-
44
-
45
-
46
 |
 |

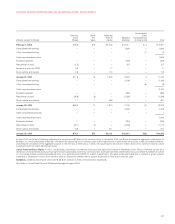
19
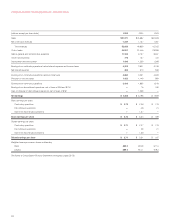
Allowance for Doubtful Accounts
(millions) 2005 2004 2003
Allowance at beginning of year $ 387 $ 352 $ 320
Bad debt provision 466 451 476
Net write-offs (402) (416) (444)
Allowance at end of year $ 451 $ 387 $ 352
As a percent of year-end receivables 7.4% 7.1% 7.1%
Other Credit Card Information
2005 2004 2003
Total revenues as a percent
of average receivables 25.6% 24.8% 24.6%
Net write-offs as a percent
of average receivables 7.2% 8.4% 9.5%
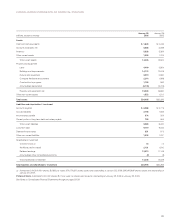
Depreciation and Amortization
In 2005, depreciation and amortization expense increased
11.9 percent, in line with our sales growth for the year, to $1,409
million. In 2004, depreciation and amortization increased 14.6 percent
to $1,259 million compared to 2003. Expense for 2004 grew faster
than sales partially due to accelerated depreciation on existing stores
that were planned to be closed, or torn down and rebuilt. In 2006,
we expect depreciation and amortization expense to increase in line
with our sales growth.
Net Interest Expense
In 2005, net interest expense was $463 million, $107 million lower
than 2004. The majority of this decrease was attributable to a
significantly smaller loss on debt repurchase in 2005 (less than
$1 million in 2005 compared to $89 million in 2004). The decrease
in 2005 net interest expense also reflected the benefit of lower average
net debt in the first half of the year due to the application of proceeds
from the mid-2004 Marshall Field’s and Mervyn’s sale transactions.
This benefit was partially offset by higher average net debt balances
in the second half of the year and a higher annual average portfolio
interest rate. For the full year, the average portfolio interest rate was
5.9 percent in 2005 and 5.5 percent in 2004.
In 2004, net interest expense was $570 million, $14 million higher
than 2003. This increase was due to a $74 million higher loss on debt
called or repurchased, as well as a higher average portfolio interest
rate resulting from the unfavorable mix effect of higher balances of
short-term investments and higher market rates. This increase was
mostly offset by significantly lower average net debt in the second
half of the year due to proceeds received from the dispositions of
Marshall Field’s and Mervyn’s. The average portfolio interest rate was
5.5 percent in 2004 and 4.9 percent in 2003. The $542 million of debt
called or repurchased during 2004 resulted in a loss of $89 million,
or approximately $.06 per share.
Our 2006 net interest expense is expected to increase due to
higher average net debt driven in part by planned share repurchase
activity. Beginning in 2005, the majority of our credit card receivables
were assessed finance charges at a prime-based floating rate instead
of a fixed rate. To preserve our net interest margin on our receivables,
we intend to maintain a sufficient level of floating-rate debt to generate
parallel changes in net interest expense and finance charge revenue.
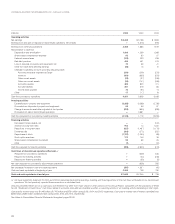
Provision for Income Taxes
Our effective income tax rate from continuing operations was
37.6 percent in 2005 and 37.8 percent in 2004 and 2003, respectively.
The slight decrease in our effective rate for 2005 related to several
non-recurring favorable components of our provision for income taxes.
We expect our effective income tax rate in 2006 to be approximately
38.0 to 38.5 percent.
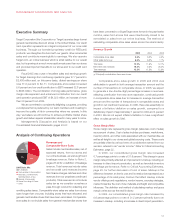
Analysis of Financial Condition
Liquidity and Capital Resources
Our financial condition remains strong. In
assessing our financial condition, we consider
factors such as cash flows provided by
operations, capital expenditures and debt
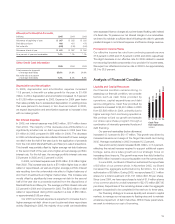
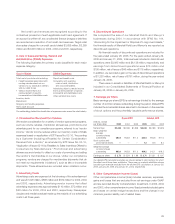
service obligations. Cash flow provided by
operations increased to $4,451 million in 2005
from $3,808 million in 2004, primarily due to
higher earnings from continuing operations.
We continue to fund our growth and execute
our share repurchase program through a
combination of internally-generated funds and
debt financing.
Our year-end receivables (before allowance)
increased 12.1 percent to $6,117 million. This growth was driven by
increased issuance and usage of the Target Visa credit card during
2005. Average receivables in 2005 increased 12.5 percent.
Year-end inventory levels increased $454 million, or 8.4 percent,
reflecting the natural increase required to support additional square
footage, same-store sales growth and our strategic focus on
increasing direct imports. This growth was more than fully funded by
the $489 million increase in accounts payable over the same period.
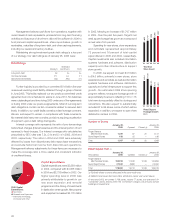
In June 2004, our Board of Directors authorized the repurchase
of $3 billion of our common stock. In November 2005, our Board
increased the aggregate authorization by $2 billion, for a total
authorization of $5 billion. During 2005, we repurchased 23.1 million
shares for a total investment of $1,197 million ($51.88 per share).
Since June 2004, we have repurchased a total of 51.6 million shares
of our common stock for a total investment of $2,473 million ($47.95
per share). Repurchase of the remaining shares under the aggregate
program is expected to be completed in the next two to three years.
Our financing strategy is to ensure liquidity and access to capital
markets, to manage our net exposure to floating rates and to maintain
a balanced spectrum of debt maturities. Within these parameters,
we seek to minimize our cost of borrowing.
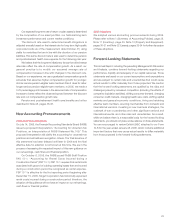
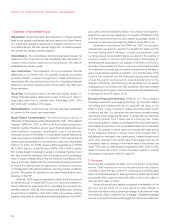
’01 ’02 ’03 ’04
$2,601
$2,703
$3,188
$3,808
Cash Flow
from Operations
(millions)
’05
$4,451