Walmart 2008 Annual Report Download - page 12
Download and view the complete annual report
Please find page 12 of the 2008 Walmart annual report below. You can navigate through the pages in the report by either clicking on the pages listed below, or by using the keyword search tool below to find specific information within the annual report.-
 1
1 -
 2
2 -
 3
3 -
 4
4 -
 5
5 -
 6
6 -
 7
7 -
 8
8 -
 9
9 -
 10
10 -
 11
11 -
 12
12 -
 13
13 -
 14
14 -
 15
15 -
 16
16 -
 17
17 -
 18
18 -
 19
19 -
 20
20 -
 21
21 -
 22
22 -
23
-
24
-
25
-
26
-
27
-
28
-
29
-
30
-
31
-
32
-
33
-
34
-
35
-
36
-
37
-
38
-
39
-
40
-
41
-
42
-
43
-
44
-
45
-
46
-
47
-
48
-
49
-
50
-
51
-
52
-
53
-
54
-
55
-
56
 |
 |

10 WAL-MART 2008 ANNUAL REPORT
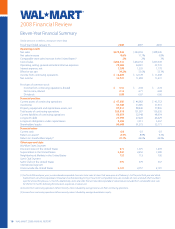
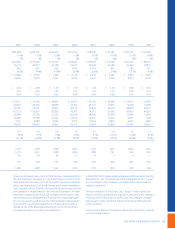
Eleven-Year Financial Summary
2008 Financial Review
(Dollar amounts in millions, except per share data)
Fiscal Year Ended January 31, 2008 2007 2006
Operating results
Net sales $374,526 $344,992 $308,945
Net sales increase 8.6% 11.7% 9.8%
Comparable store sales increase in the United States(1) 2% 2% 3%
Cost of sales $286,515 $264,152 $237,649
Operating, selling, general and administrative expenses 70,288 64,001 55,739
Interest expense, net 1,798 1,529 1,178
Eective tax rate 34.2% 33.6% 33.1%
Income from continuing operations $ 12,884 $ 12,178 $ 11,408
Net income 12,731 11,284 11,231
Per share of common stock:
Income from continuing operations, diluted $ 3.16 $ 2.92 $ 2.72
Net income, diluted 3.13 2.71 2.68
Dividends 0.88 0.67 0.60
Financial position
Current assets of continuing operations $ 47,585 $ 46,982 $ 43,752
Inventories 35,180 33,685 31,910
Property, equipment and capital lease assets, net 97,017 88,440 77,865
Total assets of continuing operations 163,514 151,587 136,230
Current liabilities of continuing operations 58,454 52,148 48,954
Long-term debt 29,799 27,222 26,429
Long-term obligations under capital leases 3,603 3,513 3,667
Shareholders’ equity 64,608 61,573 53,171
Financial ratios
Current ratio 0.8 0.9 0.9
Return on assets(2) 8.4% 8.8% 9.3%
Return on shareholders’ equity(3) 21.1% 22.0% 22.9%
Other year-end data
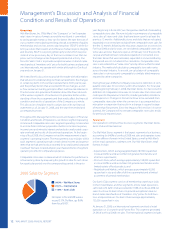
Wal-Mart Stores Segment
Discount stores in the United States 971 1,075 1,209
Supercenters in the United States 2,447 2,256 1,980
Neighborhood Markets in the United States 132 112 100
Sam’s Club Segment
Sam’s Clubs in the United States 591 579 567
International Segment
Units outside the United States 3,121 2,757 2,181
(1) For scal 2006 and prior years, we considered comparable store sales to be sales at stores that were open as of February 1st of the prior scal year and which
had not been converted, expanded or relocated since that date. Beginning in scal 2007, comparable store sales includes all stores and clubs that have been
open for at least the previous 12 months. Additionally, stores and clubs that are relocated, expanded or converted are excluded from comparable store sales
for the rst 12 months following the relocation, expansion or conversion.
(2) Income from continuing operations before minority interest divided by average total assets from continuing operations.
(3) Income from continuing operations before minority interest divided by average shareholders’ equity.