Walmart 2008 Annual Report Download - page 21
Download and view the complete annual report
Please find page 21 of the 2008 Walmart annual report below. You can navigate through the pages in the report by either clicking on the pages listed below, or by using the keyword search tool below to find specific information within the annual report.-
 1
1 -
2
-
3
-
4
-
5
-
6
-
7
-
8
-
9
-
10
-
 11
11 -
 12
12 -
 13
13 -
 14
14 -
 15
15 -
 16
16 -
 17
17 -
 18
18 -
 19
19 -
 20
20 -
 21
21 -
 22
22 -
 23
23 -
 24
24 -
 25
25 -
 26
26 -
 27
27 -
 28
28 -
 29
29 -
 30
30 -
 31
31 -
32
-
33
-
34
-
35
-
36
-
37
-
38
-
39
-
40
-
41
-
42
-
43
-
44
-
45
-
46
-
47
-
48
-
49
-
50
-
51
-
52
-
53
-
54
-
55
-
56
 |
 |

Management’s Discussion and Analysis of Financial
Condition and Results of Operations
WAL-MART 2008 ANNUAL REPORT 19
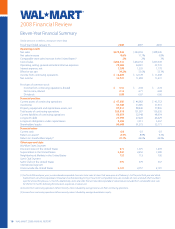
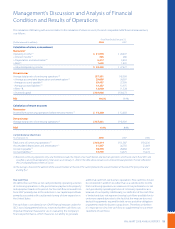
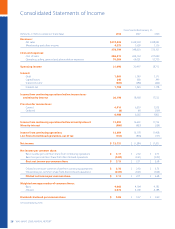
International Segment
Segment Net Segment Segment Operating
Sales Increase Operating Operating Income Income as a
from Prior Income Increase from Percentage of
Fiscal Year (in millions) Prior Fiscal Year Segment Net Sales
2008 17.5% $4,769 11.8% 5.3%
2007 30.2% 4,265 24.1% 5.5%
2006 12.7% 3,438 6.6% 5.8%
At January 31, 2008, our International segment was comprised of
wholly-owned operations in Argentina, Brazil, Canada, Puerto Rico
and the United Kingdom, the operation of joint ventures in China
and India and the operations of majority-owned subsidiaries in
Central America, Japan and Mexico.
The scal 2008 increase in the International segment’s net sales
primarily resulted from:
• net sales growth from existing units;
• our international expansion program which added 364 units, net
of relocations and closings, consisting of 34.1 million, or 17.9%, of
additional unit square footage, including the consolidation of BCL,
which added 101 stores under the Trust-Mart banner and 17.7 mil-
lion square feet in February of scal 2008;
• the consolidation of BCL; and
• the favorable impact of changes in foreign currency exchange
rates of $4.5 billion during scal 2008.
The scal 2007 increase in the International segment’s net sales
primarily resulted from:
• the consolidation of Seiyu and CARHCO and the acquisition of
Sonae, all of which added 17.1 percentage points to the increase
in scal 2007 net sales;
• net sales growth from existing units;
• our international expansion program which added 576 units, net of
relocations and closings, consisting of 20.4 million, or 12.0%, of addi-
tional unit square footage including the consolidation of CARHCO,
which added 372 stores and 6.5 million square feet in February
2006; and
• the favorable impact of changes in foreign currency exchange rates
of $1.5 billion during scal 2007.
Fiscal 2008 net sales at our United Kingdom subsidiary, ASDA, were
36.9% of the International segment net sales. Net sales for ASDA
included in our Consolidated Statements of Income during fiscal
2008, 2007 and 2006 were $33.4 billion, $28.9 billion and $26.8 billion,
respectively. The eect of changes in the exchange rate between the
British Pound and U.S. Dollar contributed $2.6 billion and $527 million
to ASDA’s net sales for scal 2008 and 2007, respectively.
In scal 2008, gross margin increased across most markets leading to
an overall 0.2 percentage point increase in the International segment’s
gross margin. Brazil and the United Kingdom were the largest contrib-
utors to the increase. Gross margin in Brazil was favorably impacted by
global sourcing initiatives and improved supplier negotiations. Fiscal
2008 gross margin in the United Kingdom was positively impacted by
a mix shift toward premium, private label food products. Fiscal 2007
gross margin was up from scal 2006, primarily due to the favorable
0.4 percentage point impact of the acquisition of Sonae and the
consolidation of Seiyu and CARHCO, and an overall 0.2 percentage
point improvement delivered by our other International markets.
The scal 2007 improvement in our other markets was primarily
driven by Mexico and Canada as a result of a favorable shift in the
mix of products sold toward general merchandise categories which
carry a higher margin.
Segment operating expenses as a percentage of segment net sales
increased 0.4 percentage points in scal 2008 primarily as a result of
an accrual for certain legal matters, the impact of restructuring and
impairment charges at Seiyu, the impact of the consolidation of BCL,
the startup of our joint venture in India and banking operations in
Mexico and overall sales pressures in Mexico. In scal 2007, segment
operating expenses as a percentage of segment net sales increased
from scal 2006 by 1.2 percentage points as a result of the consolida-
tion of Seiyu and the acquisition of Sonae and CARHCO.
Operating income was favorably impacted by changes in foreign
currency exchange rates of $222 million and $90 million in scal 2008
and 2007, respectively.
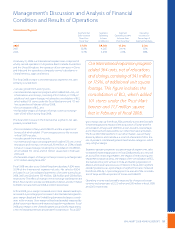
Our International expansion program
added 364 units, net of relocations
and closings, consisting of 34.1 million,
or 17.9%, of additional unit square
footage. This figure includes the
consolidation of BCL, which added
101 stores under the Trust-Mart
banner and 17.7 million square
feet in February of fiscal 2008.