Walmart 2008 Annual Report Download - page 14
Download and view the complete annual report
Please find page 14 of the 2008 Walmart annual report below. You can navigate through the pages in the report by either clicking on the pages listed below, or by using the keyword search tool below to find specific information within the annual report.-
 1
1 -
2
-
3
-
 4
4 -
 5
5 -
 6
6 -
 7
7 -
 8
8 -
 9
9 -
 10
10 -
 11
11 -
 12
12 -
 13
13 -
 14
14 -
 15
15 -
 16
16 -
 17
17 -
 18
18 -
 19
19 -
 20
20 -
 21
21 -
 22
22 -
 23
23 -
 24
24 -
25
-
26
-
27
-
28
-
29
-
30
-
31
-
32
-
33
-
34
-
35
-
36
-
37
-
38
-
39
-
40
-
41
-
42
-
43
-
44
-
45
-
46
-
47
-
48
-
49
-
50
-
51
-
52
-
53
-
54
-
55
-
56
 |
 |

12 WAL-MART 2008 ANNUAL REPORT
Overview
Wal-Mart Stores, Inc. (“Wal-Mart,” the “Company” or “we”) operates
retail stores in various formats around the world and is committed
to saving people money so they can live better. We earn the trust of
our customers every day by providing a broad assortment of quality
merchandise and services at every day low prices (“EDLP”), while fos-
tering a culture that rewards and embraces mutual respect, integrity
and diversity. EDLP is our pricing philosophy under which we price
items at a low price every day so that our customers trust that our
prices will not change under frequent promotional activity. Our
focus for Sam’s Club is to provide exceptional value on brand-name
merchandise at “members only” prices for both business and personal
use. Internationally, we operate with similar philosophies. Our scal
year ends on January 31.
We intend for this discussion to provide the reader with information
that will assist in understanding our nancial statements, the changes
in certain key items in those nancial statements from year to year,
and the primary factors that accounted for those changes, as well
as how certain accounting principles aect our nancial statements.
The discussion also provides information about the nancial results
of the various segments of our business to provide a better under-
standing of how those segments and their results aect the nancial
condition and results of operations of the Company as a whole.
This discussion should be read in conjunction with our nancial
statements as of January 31, 2008, and the year then ended and
accompanying notes.
Throughout this Management’s Discussion and Analysis of Financial
Condition and Results of Operations, we discuss segment operating
income and comparable store sales. Segment operating income refers
to income from continuing operations before net interest expense,
income taxes and minority interest and excludes unallocated corpo-
rate overhead and results of discontinued operations. At the begin-
ning of scal 2008, the Company revised the measurement of each
segment’s operating income. The measurement now includes within
each segment’s operating results certain direct income and expense
items that we had previously accounted for as unallocated corporate
overhead. We have restated all prior year measurements of segment
operating income for comparative purposes.
Comparable store sales is a measure which indicates the performance
of our existing stores by measuring the growth in sales for such stores
for a particular period over the corresponding period in the prior
year. Beginning in scal 2007, we changed our method of calculating
comparable store sales. We now include in our measure of comparable
store sales all stores and clubs that have been open for at least the
previous 12 months. Additionally, stores and clubs that are relocated,
expanded or converted are excluded from comparable store sales for
the rst 12 months following the relocation, expansion or conversion.
For scal 2006 and prior years, we considered comparable store sales
to be sales at stores that were open as of February 1st of the prior s-
cal year and had not been relocated, expanded or converted since
that date. Stores that were relocated, expanded or converted during
that period are not included in the calculation. Comparable store
sales is also referred to as “same-store” sales by others within the retail
industry. The method of calculating comparable store sales varies
across the retail industry. As a result, our calculation of comparable
store sales is not necessarily comparable to similarly titled measures
reported by other companies.
During scal year 2008, the Company reviewed its denition of com-
parable store sales for consistency with other retailers. For scal year
2009, beginning February 1, 2008, Wal-Mart Stores, Inc. has revised its
denition of comparable store sales to include sales from stores and
clubs open for the previous 12 months, including remodels, relocations
and expansions. Changes in format continue to be excluded from
comparable store sales when the conversion is accompanied by a
relocation or expansion that results in a change in square footage
of more than ve percent. Since the impact of this revision is inconse-
quential, the Company will not restate comparable store sales results
for previously reported years.
Operations
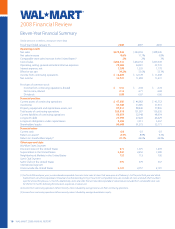
Our operations comprise three business segments: Wal-Mart Stores,
Sam’s Club and International.
Our Wal-Mart Stores segment is the largest segment of our business,
accounting for 64.0% of our scal 2008 net sales and operates stores
in three dierent formats in the United States, as well as Wal-Mart’s
online retail operations, walmart.com. Our Wal-Mart Stores retail
formats include:
• Supercenters, which average approximately 187,000 square feet
in size and oer a wide assortment of general merchandise and
a full-line supermarket;
• Discount stores, which average approximately 108,000 square feet
in size and oer a wide assortment of general merchandise and a
limited variety of food products; and
• Neighborhood Markets, which average approximately 42,000
square feet in size and oer a full-line supermarket and a limited
assortment of general merchandise.
Our Sam’s Club segment consists of membership warehouse clubs
in the United States and the segment’s online retail operations,
samsclub.com. Sam’s Club accounted for 11.8% of our scal 2008 net
sales. Our focus for Sam’s Club is to provide exceptional value on
brand-name merchandise at “members only” prices for both busi-
ness and personal use. Our Sam’s Clubs average approximately
132,000 square feet in size.
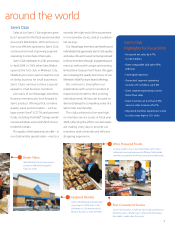
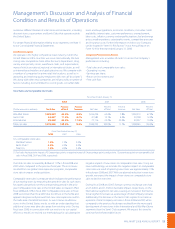
At January 31, 2008, our International segment consisted of retail
operations in 12 countries and Puerto Rico. This segment generated
24.2% of our scal 2008 net sales. The International segment includes
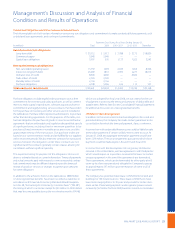
2008 Sales by Segment
Net sales in scal 2008 were a
record $374.5 billion, up 8.6%
from scal 2007.
64.0% – Wal-Mart Stores
24.2% – International
11.8% – Sam’s Club
Management’s Discussion and Analysis of Financial
Condition and Results of Operations