Walmart 2008 Annual Report Download - page 26
Download and view the complete annual report
Please find page 26 of the 2008 Walmart annual report below. You can navigate through the pages in the report by either clicking on the pages listed below, or by using the keyword search tool below to find specific information within the annual report.-
 1
1 -
2
-
3
-
4
-
5
-
6
-
7
-
8
-
9
-
10
-
11
-
12
-
13
-
14
-
15
-
 16
16 -
 17
17 -
 18
18 -
 19
19 -
 20
20 -
 21
21 -
 22
22 -
 23
23 -
 24
24 -
 25
25 -
 26
26 -
 27
27 -
 28
28 -
 29
29 -
 30
30 -
 31
31 -
 32
32 -
 33
33 -
 34
34 -
 35
35 -
 36
36 -
37
-
38
-
39
-
40
-
41
-
42
-
43
-
44
-
45
-
46
-
47
-
48
-
49
-
50
-
51
-
52
-
53
-
54
-
55
-
56
 |
 |

24 WAL-MART 2008 ANNUAL REPORT
Management’s Discussion and Analysis of Financial
Condition and Results of Operations
Market Risk
In addition to the risks inherent in our operations, we are exposed to
certain market risks, including changes in interest rates and changes
in foreign currency exchange rates.
The analysis presented for each of our market risk sensitive instruments
is based on a 10% change in interest or foreign currency exchange
rates. These changes are hypothetical scenarios used to calibrate
potential risk and do not represent our view of future market changes.
As the hypothetical gures discussed below indicate, changes in fair
value based on the assumed change in rates generally cannot be
extrapolated because the relationship of the change in assumption
to the change in fair value may not be linear. The eect of a variation
in a particular assumption is calculated without changing any other
assumption. In reality, changes in one factor may result in changes
in another, which may magnify or counteract the sensitivities.
At January 31, 2008 and 2007, we had $35.7 billion and $32.7 billion,
respectively, of long-term debt outstanding. Our weighted average
eective interest rate on long-term debt, after considering the eect
of interest rate swaps, was 4.8% and 4.9% at January 31, 2008 and 2007,
respectively. A hypothetical 10% increase in interest rates in eect
at January 31, 2008 and 2007, would have increased annual interest
expense on borrowings outstanding at those dates by $25 million
and $47 million, respectively.
At January 31, 2008 and 2007, we had $5.0 billion and $2.6 billion of
outstanding commercial paper obligations. The weighted average
interest rate, including fees, on these obligations at January 31, 2008
and 2007, was 4.0% and 5.3%, respectively. A hypothetical 10% increase
in commercial paper rates in effect at January 31, 2008 and 2007,
would have increased annual interest expense on the outstanding
balances on those dates by $20 million and $14 million, respectively.
We enter into interest rate swaps to minimize the risks and costs
associated with nancing activities, as well as to maintain an appro-
priate mix of xed- and oating-rate debt. Our preference is to main-
tain between 40% and 50% of our debt portfolio, including interest
rate swaps, in oating-rate debt. The swap agreements are contracts
to exchange xed- or variable-rates for variable- or xed-interest rate
payments periodically over the life of the instruments. The aggre-
gate fair value of these swaps represented a gain of $265 million at
January 31, 2008 and a loss of $1 million at January 31, 2007. A hypo-
thetical increase (or decrease) of 10% in interest rates from the level
in eect at January 31, 2008, would have resulted in a (loss) or gain
in value of the swaps of ($45 million) or $46 million, respectively.
A hypothetical increase (or decrease) of 10% in interest rates from the
level in eect at January 31, 2007, would have resulted in a (loss) or
gain in value of the swaps of ($95 million) or $103 million, respectively.
We hold currency swaps to hedge the foreign currency exchange
component of our net investments in the United Kingdom. The
aggregate fair value of these swaps at January 31, 2008 and 2007,
represented a loss of $75 million and $181 million, respectively.
A hypothetical 10% increase (or decrease) in the foreign currency
exchange rates underlying these swaps from the market rate would
have resulted in a (loss) or gain in the value of the swaps of ($182 mil-
lion) and $182 million, respectively, at January 31, 2008. A hypothetical
10% increase (or decrease) in the foreign currency exchange rates
underlying these swaps from the market rate would have resulted
in a (loss) or gain in the value of the swaps of ($178 million) and
$196 million, respectively, at January 31, 2007. A hypothetical 10%
change in interest rates underlying these swaps from the market
rates in eect at January 31, 2008 and 2007, would have an insigni-
cant impact on the value of the swaps.
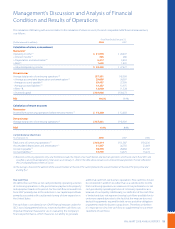
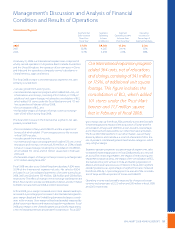
The following represents an allocation of our capital expenditures:
Allocation of Capital Expenditures
Projections Actual
Capital Expenditures Fiscal Year 2009 Fiscal Year 2008 Fiscal Year 2007
New stores, including expansions & relocations 35.4% 48.1% 51.0%
Remodels 7.6% 5.7% 5.4%
Information systems, distribution and other 22.8% 15.8% 21.5%
Total United States 65.8% 69.6% 77.9%
International 34.2% 30.4% 22.1%
Total capital expenditures 100.0% 100.0% 100.0%