Walmart 2008 Annual Report Download - page 3
Download and view the complete annual report
Please find page 3 of the 2008 Walmart annual report below. You can navigate through the pages in the report by either clicking on the pages listed below, or by using the keyword search tool below to find specific information within the annual report.-
 1
1 -
 2
2 -
 3
3 -
 4
4 -
 5
5 -
 6
6 -
 7
7 -
 8
8 -
 9
9 -
 10
10 -
 11
11 -
 12
12 -
 13
13 -
 14
14 -
15
-
16
-
17
-
18
-
19
-
20
-
21
-
22
-
23
-
24
-
25
-
26
-
27
-
28
-
29
-
30
-
31
-
32
-
33
-
34
-
35
-
36
-
37
-
38
-
39
-
40
-
41
-
42
-
43
-
44
-
45
-
46
-
47
-
48
-
49
-
50
-
51
-
52
-
53
-
54
-
55
-
56
 |
 |

1 WALMART 2008 ANNUAL REPORT
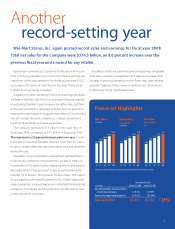
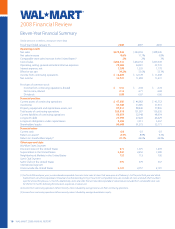
Operating income was up 7.3 percent for the year, with income
from continuing operations up 5.8 percent. Diluted earnings per
share from continuing operations for the scal year were $3.16,
an increase of 8.2 percent over the previous year. These are all
indications of our strong Company.
In addition to sales, operating income and earnings per share,
we believe that free cash ow is an important nancial measure
in evaluating Wal-Mart’s performance. We dene free cash ow
as the cash provided by operating activities, less our payments
for property and equipment (capital expenditures). Our priorities
for cash remain the same: expansion, strategic acquisitions,
payment of dividends and share repurchase.
The Company generated $5.4 billion in free cash flow in
fiscal year 2008, compared to $4.3 billion in fiscal year 2007.
This represents a 25 percent increase year over year. It is also
important to note that Wal-Mart returned more than $11 billion
in cash to shareholders through share repurchase and dividends
during the year.
Wal-Mart is very committed to a disciplined capital eciency
model as we continue to emphasize the Company’s return on
investment, or ROI, which involves balancing returns and growth.
We assess which strategy is best to win in each community –
whether it’s in Arizona, Pennsylvania, China or Brazil. This means
we are balancing the need for growth in the United States with
opportunities for continued expansion in Wal-Mart’s International
operations. Our capital spending decisions are directed at maxi-
mizing returns for all projects.
In addition to ROI, we remain focused on improving comparable
store sales, inventory management and expense leverage. And,
our goal of growing operating income faster than sales remains
a priority. Together, these measures reinforce our commitment
to delivering strong shareholder value.
Another
record-setting year
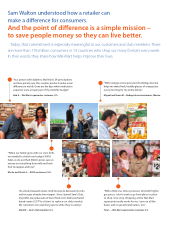
Wal-Mart Stores, Inc. again posted record sales and earnings for fiscal year 2008.
Total net sales for the Company were $374.5 billion, an 8.6 percent increase over the
previous scal year and a record for any retailer.
Financial Highlights
Twelve Months Ended
$ in millions
January 31, 2008 January 31, 2007
Net cash provided by operating activities
of continuing operations $ 20,354 $ 19,997
Payments for property and equipment $(14,937) $(15,666)
Free cash flow $5,417 $4,331
25%
1
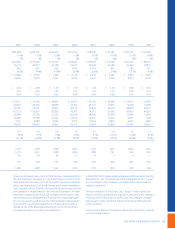
Net Sales*
$ in billions
252.8
281.5 308.9
345.0
374.5
04 07 080605
Earnings
Per Share
in $
2.08
2.46
2.72 2.92
3.16
04 07 080605
Operating
Income*
$ in billions
15.3
17.3 18.7
20.5
22.0
04 07 080605
* Amounts exclude the operations of Germany and South Korea which were sold in fiscal 2007.