Walmart 2008 Annual Report Download - page 18
Download and view the complete annual report
Please find page 18 of the 2008 Walmart annual report below. You can navigate through the pages in the report by either clicking on the pages listed below, or by using the keyword search tool below to find specific information within the annual report.-
 1
1 -
2
-
3
-
4
-
5
-
6
-
7
-
 8
8 -
 9
9 -
 10
10 -
 11
11 -
 12
12 -
 13
13 -
 14
14 -
 15
15 -
 16
16 -
 17
17 -
 18
18 -
 19
19 -
 20
20 -
 21
21 -
 22
22 -
 23
23 -
 24
24 -
 25
25 -
 26
26 -
 27
27 -
 28
28 -
29
-
30
-
31
-
32
-
33
-
34
-
35
-
36
-
37
-
38
-
39
-
40
-
41
-
42
-
43
-
44
-
45
-
46
-
47
-
48
-
49
-
50
-
51
-
52
-
53
-
54
-
55
-
56
 |
 |

16 WAL-MART 2008 ANNUAL REPORT
Management’s Discussion and Analysis of Financial
Condition and Results of Operations
Results of Operations
Consolidated Results of Operations
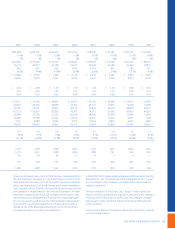
Our total net sales increased by 8.6% and 11.7% in scal 2008 and 2007
when compared to the previous scal year. Those increases resulted
from our global store expansion programs, comparable store sales
increases and acquisitions. During scal 2008 and 2007, foreign cur-
rency exchange rates had a $4.5 billion and $1.5 billion favorable
impact, respectively, on the International segment’s net sales, causing
an increase in the International segment’s net sales as a percentage
of total net sales relative to the Wal-Mart Stores and Sam’s Club
segments. The acquisition of Sonae and consolidation of Seiyu and
CARHCO resulted in a 3.2% increase in net sales for scal 2007.
Our gross margin was 23.5%, 23.4% and 23.1% in scal 2008, 2007 and
2006, respectively. Our Wal-Mart Stores and International segment
sales yield higher gross margins than our Sam’s Club segment. How-
ever, our Wal-Mart Stores and International segments produced lower
segment net sales increases in scal 2008 compared to sales increases
in scal 2007. Additionally, the increase in gross margin in scal 2008
included a $97 million refund of excise taxes previously paid on past
merchandise sales of prepaid phone cards. In scal 2007, the greater
increases in net sales for the Wal-Mart Stores and International seg-
ments had a favorable impact on the Company’s total gross margin.
Operating expenses as a percentage of net sales were 18.8%, 18.6%
and 18.0% for scal 2008, 2007 and 2006, respectively. In the rst half
of scal 2008, operating expenses include the net favorable impact
of a change in estimated losses associated with our general liability
and workers’ compensation claims which reduced our accrued liabilities
for such claims by $298 million pre-tax, partially oset by $183 million
in pre-tax charges for certain litigation and other contingencies. Addi-
tionally, the fourth quarter of scal 2008 included $106 million of
pre-tax charges related to U.S. real estate projects dropped as a result
of our capital eciency program. The net impact of these items had
no eect on our operating expenses as a percentage of net sales in
scal 2008. Otherwise, operating expenses as a percentage of net
sales increased in scal 2008 primarily due to lower segment net sales
increases compared to the prior year for our Wal-Mart Stores and
International segments as well as increases in certain operating
expenses in each segment.
Operating expenses as a percentage of net sales were higher in
scal 2007 than the preceding year primarily due to the consolidated
operations of Seiyu and Sonae, which are entities with less favorable
operating expense leverage than our other International operations,
partially oset by $85 million in property-insurance related gains.
The remainder of the increase in operating expenses as a percentage
of total net sales was due to faster growth rates in our International
segment relative to our Wal-Mart Stores and Sam’s Club segments and
slightly higher corporate-level general and administrative expenses.
Membership and other income, which includes a variety of income
categories such as Sam’s Club membership fee revenues, tenant
income and nancial services income, increased as a percentage of
net sales for scal 2008 from the prior year period due to continued
growth in our nancial services area and recycling income. Member-
ship and other income for scal 2008 also includes the recognition
of $188 million in pre-tax gains from the sale of certain real estate
properties. In scal 2007, membership and other income increased
as a percentage of net sales from the prior year due to other income
from the newly consolidated operations of Seiyu and Sonae, the
continued growth in our nancial services area and increases in our
Sam’s Club membership fee revenues.
Interest, net, as a percentage of net sales increased slightly from scal
2006 through scal 2008. The increase in interest, net, of $269 million
and $351 million in scal 2008 and scal 2007, respectively, primarily
resulted from increased borrowing levels and higher interest rates on
our oating rate debt.
Our eective income tax rates for scal 2008, 2007 and 2006 were 34.2%,
33.6% and 33.1%, respectively. The scal 2008 rate was higher than
the scal 2007 rate primarily due to the mix of taxable income among
our domestic and international operations and favorable resolution
of certain federal and state tax contingencies in scal 2007 in excess
of those in scal 2008. The scal 2007 rate was higher than the scal
2006 rate primarily due to favorable resolution of certain federal and
state tax contingencies in scal 2006 in excess of those in scal 2007.
We expect our tax rate for scal 2009 to be within the range of 34 to
35 percent.
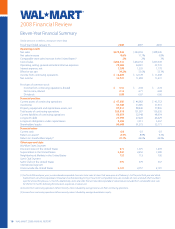
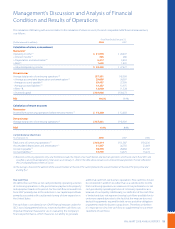
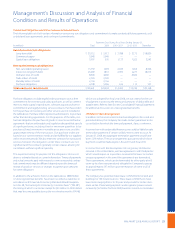
The following table reconciles net cash provided by operating activities of continuing operations, a GAAP measure, to free cash ow,
a non-GAAP measure (amounts in millions).
Fiscal Year Ended January 31,
2008 2007 2006
Net cash provided by operating activities of continuing operations $ 20,354 $ 19,997 $ 18,343
Payments for property and equipment (14,937) (15,666) (14,530)
Free cash ow $ 5,417 $ 4,331 $ 3,813
Net cash used in investing activities of continuing operations $(15,670) $(14,507) $(14,156)
Net cash used in nancing activities of continuing operations $ (7,134) $ (4,839) $ (2,422)
Our consolidated gross margin was
23.5%, 23.4% and 23.1% in fiscal
2008, 2007 and 2006, respectively.