Walmart 2008 Annual Report Download - page 15
Download and view the complete annual report
Please find page 15 of the 2008 Walmart annual report below. You can navigate through the pages in the report by either clicking on the pages listed below, or by using the keyword search tool below to find specific information within the annual report.-
 1
1 -
2
-
3
-
4
-
 5
5 -
 6
6 -
 7
7 -
 8
8 -
 9
9 -
 10
10 -
 11
11 -
 12
12 -
 13
13 -
 14
14 -
 15
15 -
 16
16 -
 17
17 -
 18
18 -
 19
19 -
 20
20 -
 21
21 -
 22
22 -
 23
23 -
 24
24 -
 25
25 -
26
-
27
-
28
-
29
-
30
-
31
-
32
-
33
-
34
-
35
-
36
-
37
-
38
-
39
-
40
-
41
-
42
-
43
-
44
-
45
-
46
-
47
-
48
-
49
-
50
-
51
-
52
-
53
-
54
-
55
-
56
 |
 |

WAL-MART 2008 ANNUAL REPORT 13
numerous dierent formats of retail stores and restaurants, including
discount stores, supercenters and Sam’s Clubs that operate outside
the United States.
For certain nancial information relating to our segments, see Note 11
to our Consolidated Financial Statements.
The Retail Industry
We operate in the highly competitive retail industry in both the
United States and the countries we serve internationally. We face
strong sales competition from other discount, department, drug,
variety and specialty stores, warehouse clubs, and supermarkets,
many of which are national, regional or international chains, as well
as internet-based retailers and catalog businesses. We compete with
a number of companies for prime retail site locations, as well as in
attracting and retaining quality employees (who we call “associates”).
We, along with other retail companies, are inuenced by a number of
factors including, but not limited to: cost of goods, consumer debt
levels and buying patterns, economic conditions, consumer credit
availability, interest rates, customer preferences, unemployment,
labor costs, ination, currency exchange uctuations, fuel and energy
prices, weather patterns, catastrophic events, competitive pressures
and insurance costs. Further information on risks to our Company
can be located in “Item 1A. Risk Factors” in our Annual Report on
Form 10-K for the year ended January 31, 2008.
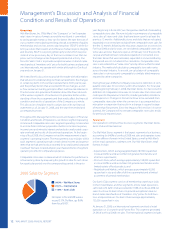
Company Performance Metrics
Management uses a number of metrics to assess the Company’s
performance including:
• Total sales and comparable store sales;
• Operating income;
• Earnings per share;
• Return on investment; and
• Free cash ow.
Management’s Discussion and Analysis of Financial
Condition and Results of Operations
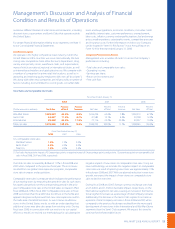
Total Sales and Comparable Store Sales
Fiscal Year Ended January 31,
2008 2007 2006
Percent Percent Percent Percent Percent
(Dollar amounts in millions) Net Sales of Total Increase Net Sales of Total Increase Net Sales of Total
Wal-Mart Stores $239,529 64.0% 5.8% $226,294 65.6% 7.8% $209,910 67.9%
Sam’s Club 44,357 11.8% 6.7% 41,582 12.1% 4.5% 39,798 12.9%
International 90,640 24.2% 17.5% 77,116 22.3% 30.2% 59,237 19.2%
Total net sales $374,526 100.0% 8.6% $344,992 100.0% 11.7% $308,945 100.0%
Fiscal Year Ended January 31,
2008 2007 2006
U.S. comparable store sales
Wal-Mart Stores 1.0% 1.9% 3.0%
Sam’s Club (1) 4.9% 2.5% 5.0%
Total U.S. 1.6% 2.0% 3.4%
(1) Fuel sales had a positive impact of 0.7 percentage points, a negative impact of 0.4 percentage points, and positive 1.3 percentage points on comparable club
sales in scal 2008, 2007 and 2006, respectively.
Our total net sales increased by 8.6% and 11.7% in scal 2008 and
2007 when compared to the previous scal year. Those increases
resulted from our global store expansion programs, comparable
store sales increases and acquisitions.
Comparable store sales is a measure which indicates the performance
of our existing stores by measuring the growth in sales for such stores
for a particular period over the corresponding period in the prior
year. Comparable store sales in the United States increased 1.6% in
scal 2008 and 2.0% in scal 2007. Comparable store sales in scal
2008 were lower than scal 2007 due to softness in the home and
apparel categories and pressure from new store expansions within
the trade area of established stores. As we continue to add new
stores in the United States, we do so with an understanding that
additional stores may take sales away from existing units. During
scal year 2008, in connection with our revisions to our capital
eciency model, we revised our methodology for calculating the
negative impact of new stores on comparable store sales. Using our
new methodology, we estimate the negative impact on comparable
store sales as a result of opening new stores was approximately 1.5%
in scal years 2008 and 2007. With our planned reduction in new store
growth, we expect the impact of new stores on comparable store
sales to decline over time.
During scal 2008 and 2007, foreign currency exchange rates had
a $4.5 billion and $1.5 billion favorable impact, respectively, on the
International segment’s net sales, causing an increase in the Interna-
tional segment’s net sales as a percentage of total Company net sales.
Additionally, the decrease in the Sam’s Club segment’s net sales as
a percent of total Company net sales in scal 2008 and 2007, when
compared to the previous scal years resulted from the more rapid
development of new stores in the International and Wal-Mart Stores
segments than the Sam’s Club segment. We expect this trend to
continue for the foreseeable future.