Walmart 2008 Annual Report Download - page 17
Download and view the complete annual report
Please find page 17 of the 2008 Walmart annual report below. You can navigate through the pages in the report by either clicking on the pages listed below, or by using the keyword search tool below to find specific information within the annual report.-
 1
1 -
2
-
3
-
4
-
5
-
6
-
 7
7 -
 8
8 -
 9
9 -
 10
10 -
 11
11 -
 12
12 -
 13
13 -
 14
14 -
 15
15 -
 16
16 -
 17
17 -
 18
18 -
 19
19 -
 20
20 -
 21
21 -
 22
22 -
 23
23 -
 24
24 -
 25
25 -
 26
26 -
 27
27 -
28
-
29
-
30
-
31
-
32
-
33
-
34
-
35
-
36
-
37
-
38
-
39
-
40
-
41
-
42
-
43
-
44
-
45
-
46
-
47
-
48
-
49
-
50
-
51
-
52
-
53
-
54
-
55
-
56
 |
 |

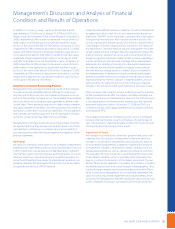
Management’s Discussion and Analysis of Financial
Condition and Results of Operations
WAL-MART 2008 ANNUAL REPORT 15
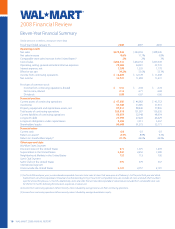
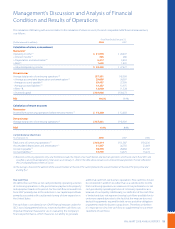
Free Cash Flow
We dene free cash ow as net cash provided by operating activities
of continuing operations in the period minus payments for property
and equipment made in the period. Our free cash ow increased from
scal 2007 primarily due to the reduction in our capital expenditures
primarily associated with our planned slowing of store expansion in
the United States.
Free cash ow is considered a non-GAAP nancial measure under the
SEC’s rules. Management believes, however, that free cash ow is an
important nancial measure for use in evaluating the Company’s
financial performance, which measures our ability to generate
additional cash from our business operations. Free cash ow should
be considered in addition to, rather than as a substitute for, income
from continuing operations as a measure of our performance or net
cash provided by operating activities of continuing operations as a
measure of our liquidity. Additionally, our denition of free cash ow
is limited and does not represent residual cash ows available for dis-
cretionary expenditures due to the fact that the measure does not
deduct the payments required for debt service and other obligations
or payments made for business acquisitions. Therefore, we believe
it is important to view free cash ow as supplemental to our entire
statement of cash ows.
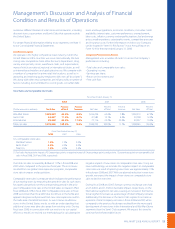
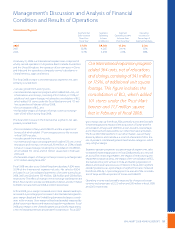
The calculation of ROI along with a reconciliation to the calculation of return on assets, the most comparable GAAP nancial measurement,
is as follows:
Fiscal Year Ended January 31,
(Dollar amounts in millions) 2008 2007
Calculation of return on investment
Numerator
Operating income (1) $ 21,996 $ 20,497
+ Interest income (1) 305 280
+ Depreciation and amortization (1) 6,317 5,459
+ Rent (1) 1,620 1,441
= Adjusted operating income $ 30,238 $ 27,677
Denominator
Average total assets of continuing operations (2) 157,551 143,909
+ Average accumulated depreciation and amortization (2) 29,059 24,907
- Average accounts payable (2) 29,427 27,096
- Average accrued liabilities (2) 15,237 13,975
+ Rent * 8 12,960 11,528
= Invested capital $154,906 $139,273
ROI 19.5% 19.9%
Calculation of return on assets
Numerator
Income from continuing operations before minority interest (1) $ 13,290 $ 12,603
Denominator
Average total assets of continuing operations (2) $157,551 $143,909
ROA 8.4% 8.8%
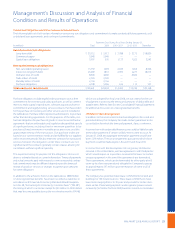
Certain Balance Sheet Data
As of January 31, 2008 2007 2006
Total assets of continuing operations (1) $163,514 $151,587 $136,230
Accumulated depreciation and amortization (1) 31,367 26,750 23,064
Accounts payable (1) 30,370 28,484 25,707
Accrued liabilities (1) 15,799 14,675 13,274
(1) Based on continuing operations only; and, therefore excludes the impact of our South Korean and German operations, which were sold in scal 2007 and
classied as discontinued operations. Total assets as of January 31, 2006 in the table above exclude assets of discontinued operations that are reected in
the Consolidated Balance Sheets of $2,563.
(2) The average is based on the addition of the account balance at the end of the current period to the account balance at the end of the prior period and
dividing by 2.