Walmart 2008 Annual Report Download - page 16
Download and view the complete annual report
Please find page 16 of the 2008 Walmart annual report below. You can navigate through the pages in the report by either clicking on the pages listed below, or by using the keyword search tool below to find specific information within the annual report.-
 1
1 -
2
-
3
-
4
-
5
-
 6
6 -
 7
7 -
 8
8 -
 9
9 -
 10
10 -
 11
11 -
 12
12 -
 13
13 -
 14
14 -
 15
15 -
 16
16 -
 17
17 -
 18
18 -
 19
19 -
 20
20 -
 21
21 -
 22
22 -
 23
23 -
 24
24 -
 25
25 -
 26
26 -
27
-
28
-
29
-
30
-
31
-
32
-
33
-
34
-
35
-
36
-
37
-
38
-
39
-
40
-
41
-
42
-
43
-
44
-
45
-
46
-
47
-
48
-
49
-
50
-
51
-
52
-
53
-
54
-
55
-
56
 |
 |

14 WAL-MART 2008 ANNUAL REPORT
Management’s Discussion and Analysis of Financial
Condition and Results of Operations
Operating income growth greater than net sales growth is a meaningful
measure because it indicates how eectively we manage costs and
leverage expenses. For scal 2008, our operating income increased
by 7.3% when compared to scal 2007, while net sales increased by
8.6% over the same period. For the individual segments, our Sam’s
Club segment met this target; however, our Wal-Mart Stores and
International segments did not. The Wal-Mart Stores segment fell
short of this objective as growth in operating, selling, general and
administrative expenses (“operating expenses”) outpaced improve-
ments in gross prot as a percentage of net sales (our “gross margin”)
and other income. The International segment fell short of this objective
due to the impact of the newly acquired and consolidated entities.
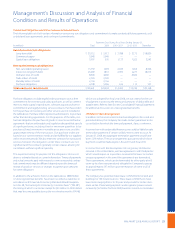
Earnings Per Share
Fiscal Year Ended January 31,
2008 2007 2006
Diluted income per share from
continuing operations $3.16 $2.92 $2.72
Diluted earnings per share increased in scal 2008 as a result of
increases in income from continuing operations in conjunction with
share repurchases reducing the number of weighted average shares
outstanding. For scal 2007, diluted earnings per share increased as
a result of increases in income from continuing operations.
Return on Investment
Management believes return on investment (“ROI”) is a meaningful
metric to share with investors because it helps investors assess how
eciently Wal-Mart is employing its assets. ROI was 19.5% for scal
year 2008 and 19.9% for scal year 2007. The decrease in ROI in scal
2008 resulted from our adjusted operating income growing at a
slower rate than our invested capital, including recent investments
in Seiyu, CARHCO, Sonae and Bounteous Company Ltd. (“BCL”).
We dene ROI as adjusted operating income (operating income plus
interest income and depreciation and amortization and rent from
continuing operations) for the scal year or trailing twelve months
divided by average investment during that period. We consider aver-
age investment to be the average of our beginning and ending total
assets of continuing operations plus accumulated depreciation and
amortization less accounts payable and accrued liabilities for that
period, plus a rent factor equal to the rent for the scal year or trailing
twelve months multiplied by a factor of eight.
ROI is considered a non-GAAP nancial measure under the SEC’s
rules. We consider return on assets (“ROA”) to be the nancial mea-
sure computed in accordance with generally accepted accounting
principles (“GAAP”) that is the most directly comparable nancial
measure to ROI as we calculate that nancial measure. ROI diers
from return on assets (income from continuing operations before
minority interest for the scal year or the trailing twelve months
divided by average of total assets of continuing operations for the
period) because: ROI adjusts operating income to exclude certain
expense items and add interest income; it adjusts total assets from
continuing operations for the impact of accumulated depreciation
and amortization, accounts payable and accrued liabilities; and it
incorporates a factor of rent to arrive at total invested capital.
Although ROI is a standard financial metric, numerous methods
exist for calculating a company’s ROI. As a result, the method used
by management to calculate ROI may dier from the method other
companies use to calculate their ROI. We urge you to understand
the method used by another company to calculate its ROI before
comparing our ROI to that of the other company.
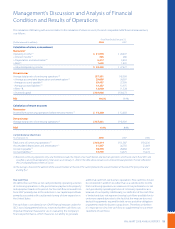
Operating Income
Fiscal Year Ended January 31,
Percent Percent Percent Percent Percent
(Dollar amounts in millions) Net Sales of Total Increase Net Sales of Total Increase Net Sales of Total
Wal-Mart Stores $17,516 79.6% 5.4% $16,620 81.1% 8.9% $15,267 81.6%
Sam’s Club 1,618 7.4% 9.3% 1,480 7.2% 5.2% 1,407 7.5%
International 4,769 21.7% 11.8% 4,265 20.8% 24.1% 3,438 18.4%
Other (1,907) -8.7% 2.1% (1,868) -9.1% 33.5% (1,399) -7.5%
Total operating income $21,996 100.0% 7.3% $20,497 100.0% 9.5% $18,713 100.0%
Wal-Mart Stores, Inc. Operating Income
(Dollars in millions)
Wal-Mart Stores, Inc. operating
income increased 7.3% in scal
2008, driven by an 11.8% increase
in International.
06 07 08
0
$ 6,000
$12,000
$18,000
$24,000