Walmart 2008 Annual Report Download - page 19
Download and view the complete annual report
Please find page 19 of the 2008 Walmart annual report below. You can navigate through the pages in the report by either clicking on the pages listed below, or by using the keyword search tool below to find specific information within the annual report.-
 1
1 -
2
-
3
-
4
-
5
-
6
-
7
-
8
-
 9
9 -
 10
10 -
 11
11 -
 12
12 -
 13
13 -
 14
14 -
 15
15 -
 16
16 -
 17
17 -
 18
18 -
 19
19 -
 20
20 -
 21
21 -
 22
22 -
 23
23 -
 24
24 -
 25
25 -
 26
26 -
 27
27 -
 28
28 -
 29
29 -
30
-
31
-
32
-
33
-
34
-
35
-
36
-
37
-
38
-
39
-
40
-
41
-
42
-
43
-
44
-
45
-
46
-
47
-
48
-
49
-
50
-
51
-
52
-
53
-
54
-
55
-
56
 |
 |

Management’s Discussion and Analysis of Financial
Condition and Results of Operations
WAL-MART 2008 ANNUAL REPORT 17
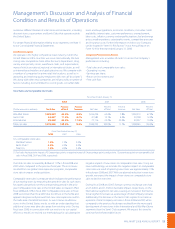
The segment net sales increases resulted from comparable store sales
increases of 1.0% in scal 2008 and 1.9% in scal 2007, in addition to
our expansion program. Lower comparable store sales performance
is due to a decrease in customer trac, partially oset by an increase
in average transaction size per customer. In addition, softness in the
home and apparel categories and pressure from new store expansion
within the trade area of established stores also contributed to the
decline in comparable store sales. We have developed several initia-
tives to help mitigate new store expansion pressure and to grow
comparable store sales. These initiatives include becoming more
relevant to the customer by creating a better store shopping experi-
ence, continuing to improve our merchandise assortment and slowing
new store growth.
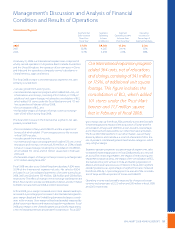
The Wal-Mart Stores segment expansion programs consist of opening
new units, converting discount stores to supercenters, relocations
that result in more square footage, as well as expansions of existing
stores. During scal 2008 we opened seven discount stores, 20 Neigh-
borhood Markets and 191 supercenters (including the conversion
and/or relocation of 109 existing discount stores into supercenters).
Two discount stores closed in scal 2008. During scal 2008, our total
expansion program added approximately 26 million of store square
footage, a 4.8% increase. During scal 2007 we opened 15 discount
stores, 12 Neighborhood Markets and 279 supercenters (including
the conversion of 147 existing discount stores into supercenters).
Two discount stores and three supercenters closed in scal 2007.
During scal 2007, our total expansion program added approximately
42 million of store square footage, an 8.4% increase.
In scal 2008, gross margin increased slightly compared to the prior
year primarily due to higher initial margins and decreased markdown
activity as a result of improved inventory management in the second
half of the year, partially oset by higher inventory shrinkage. In addi-
tion, gross margin for scal 2008 included a $46 million excise tax
refund on taxes previously paid on past prepaid phone card sales.
In scal 2007, gross margin increased 0.2 percentage points from the
prior year, which can be attributed to improved initial margin rates in
our general merchandise and food categories and an adjustment to
our product warranty liabilities which had an unfavorable impact on
gross margin in scal 2006. In scal 2007, our gross margin increased
despite expanding our competitive pricing initiatives and our increase
in the cost of markdowns as a percentage of segment net sales, which
primarily occurred in our home and apparel merchandise assortments.
Segment operating expenses as a percentage of segment net sales
increased 0.2 percentage points in scal 2008 compared to the prior
year. In the rst half of scal 2008, operating expenses include the
favorable impact of a change in estimated losses associated with our
general liability and workers’ compensation claims, which reduced
the accrued liabilities for such claims by $274 million pretax, partially
oset by the unfavorable impact of $145 million in pre-tax charges
for certain legal and other contingencies. Additionally, the fourth
quarter of scal 2008 included $106 million of pre-tax charges related
to U.S. real estate projects dropped as a result of our capital eciency
program. The net impact of these items had no eect on our operating
expenses as a percentage of segment net sales in scal 2008. Other-
wise, operating expenses as a percentage of segment net sales
increased primarily due to lower segment net sales increases com-
pared to the prior year and higher costs associated with our store
maintenance and remodel programs.
Segment operating expenses as a percentage of segment net sales
in scal 2007 were essentially at from scal 2006, primarily due to
improved labor productivity in the stores, which was oset by higher
costs associated with our store maintenance and remodel programs.
Additionally, operating expenses for fiscal year 2007 include the
favorable impact of property insurance-related gains of $79 million.
Other income in scal 2008 increased from the prior year due to con-
tinued growth in our nancial services area and increases in recycling
income. Additionally, other income, net, for scal 2008 includes pre-tax
gains of $188 million from the sale of certain real estate properties.
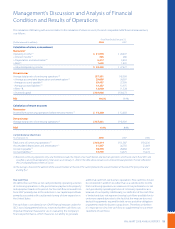
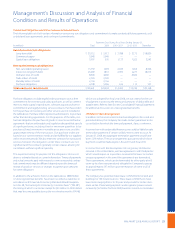
Wal-Mart Stores Segment
Segment Net Segment Segment Operating
Sales Increase Operating Operating Income Income as a
from Prior Income Increase from Percentage of
Fiscal Year (in millions) Prior Fiscal Year Segment Net Sales
2008 5.8% $17,516 5.4% 7.3%
2007 7.8% 16,620 8.9% 7.3%
2006 9.4% 15,267 9.8% 7.3%
During fiscal 2008, our total
Wal-Mart Stores’ expansion program
added approximately 26 million
of store square footage, a 4.8%
increase.