Walmart 2008 Annual Report Download - page 25
Download and view the complete annual report
Please find page 25 of the 2008 Walmart annual report below. You can navigate through the pages in the report by either clicking on the pages listed below, or by using the keyword search tool below to find specific information within the annual report.-
 1
1 -
2
-
3
-
4
-
5
-
6
-
7
-
8
-
9
-
10
-
11
-
12
-
13
-
14
-
 15
15 -
 16
16 -
 17
17 -
 18
18 -
 19
19 -
 20
20 -
 21
21 -
 22
22 -
 23
23 -
 24
24 -
 25
25 -
 26
26 -
 27
27 -
 28
28 -
 29
29 -
 30
30 -
 31
31 -
 32
32 -
 33
33 -
 34
34 -
 35
35 -
36
-
37
-
38
-
39
-
40
-
41
-
42
-
43
-
44
-
45
-
46
-
47
-
48
-
49
-
50
-
51
-
52
-
53
-
54
-
55
-
56
 |
 |

Management’s Discussion and Analysis of Financial
Condition and Results of Operations
WAL-MART 2008 ANNUAL REPORT 23
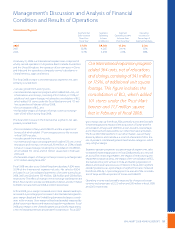
Future Expansion
We expect to make capital expenditures of approximately $13.5 billion
to $15.2 billion in scal 2009. We plan to nance this expansion and
any acquisitions of other operations that we may make during scal
2009 primarily out of cash ows from operations.
Fiscal 2009 capital expenditures will include the addition
of the following new, relocated and expanded units:
Fiscal Year 2009
Projected Unit Growth
Discount Stores —
Supercenters 170
Neighborhood Markets 25
Total Wal-Mart Stores Segment 195
Sam’s Club Segment 25
Total United States 220
Total International Segment 400
Grand Total 620
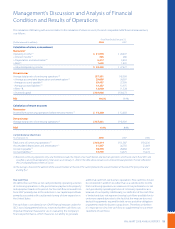
Fiscal Year Ended January 31,
(Amounts in millions except for the calculated ratio) 2008 2007
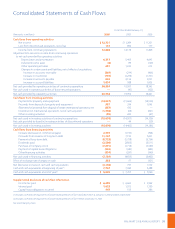
Net cash provided by operating activities of continuing operations $20,354 $19,997
+ Two-thirds current period operating rent expense (1) 1,080 961
- Current year capitalized interest expense 150 182
Numerator $21,284 $20,776
Average debt (2) $41,845 $38,874
Eight times average operating rent expense (3) 12,244 9,604
Denominator $54,089 $48,478
Adjusted cash ow from operations to average debt (4) 39% 43%
Numerator
Net cash provided by operating activities of continuing operations $20,354 $19,997
Denominator
Average debt (2) $41,845 $38,874
Cash ows from operating activities of continuing
operations to average debt 49% 51%
Selected nancial information
Current period operating rent expense $ 1,620 $ 1,441
Prior period operating rent expense 1,441 960
Current period capitalized interest 150 182
Certain Balance Sheet Information
January 31, 2008 2007 2006
Commercial paper $ 5,040 $ 2,570 $ 3,754
Long-term debt due within one year 5,913 5,428 4,595
Obligations under capital leases due within one year 316 285 284
Long-term debt 29,799 27,222 26,429
Long-term obligations under capital leases 3,603 3,513 3,667
Total debt $44,671 $39,018 $38,729
(1) 2/3 X $1,620 for scal year 2008 and 2/3 X $1,441 for scal year 2007.
(2) ($44,671 + $39,018)/2 for scal year 2008 and ($39,018 + $38,729)/2 for scal year 2007.
(3) 8 X (($1,620 + $1,441)/2) for scal year 2008 and 8 X (($1,441 + $960)/2) for scal year 2007.
(4) The calculation of the ratio as dened.