Walmart 2008 Annual Report Download - page 20
Download and view the complete annual report
Please find page 20 of the 2008 Walmart annual report below. You can navigate through the pages in the report by either clicking on the pages listed below, or by using the keyword search tool below to find specific information within the annual report.-
 1
1 -
2
-
3
-
4
-
5
-
6
-
7
-
8
-
9
-
 10
10 -
 11
11 -
 12
12 -
 13
13 -
 14
14 -
 15
15 -
 16
16 -
 17
17 -
 18
18 -
 19
19 -
 20
20 -
 21
21 -
 22
22 -
 23
23 -
 24
24 -
 25
25 -
 26
26 -
 27
27 -
 28
28 -
 29
29 -
 30
30 -
31
-
32
-
33
-
34
-
35
-
36
-
37
-
38
-
39
-
40
-
41
-
42
-
43
-
44
-
45
-
46
-
47
-
48
-
49
-
50
-
51
-
52
-
53
-
54
-
55
-
56
 |
 |

18 WAL-MART 2008 ANNUAL REPORT
Management’s Discussion and Analysis of Financial
Condition and Results of Operations
Growth in net sales for the Sam’s Club segment in scal 2008 and scal
2007 resulted from comparable club sales increases of 4.9% in scal
2008 and 2.5% in scal 2007, along with our club expansion program.
Comparable club sales in scal 2008 increased at a faster rate than
in scal 2007 primarily due to higher growth in food, pharmacy, elec-
tronics and certain consumables categories as well as an increase in
both member trac and average transaction size per member. Fuel
sales had a positive impact of 0.7 percentage points on comparable
club sales in scal 2008, while contributing a negative impact of
0.4 percentage points to scal 2007 comparable club sales.
Sam’s Club segment expansion consisted of the opening of 12 new
clubs in scal 2008 and 15 clubs in scal 2007. No clubs were closed
in scal 2008, but three clubs were closed in scal 2007. Our total
expansion program added 2.0 million of additional club square
footage, or 2.6%, in scal 2008 and 2.9 million, or 3.9%, of additional
club square footage in scal 2007.
Gross margin increased during scal 2008 due to strong sales in fresh
food and other food-related categories, pharmacy and certain con-
sumables categories, in addition to the $39 million excise tax refund
on taxes previously paid on prior period prepaid phone card sales. In
scal 2007, gross margin increased compared to the prior year due to
strong sales in certain higher margin categories, including pharmacy
and jewelry.
Operating expenses as a percentage of segment net sales decreased
in scal 2008 when compared to scal 2007 primarily due to a decrease
in advertising costs. In the rst half of scal 2008, operating expenses
include the net positive impact of the favorable change in estimated
losses associated with our general liability and workers’ compensation
claims, which reduced the accrued liabilities for such claims by $21 mil-
lion pretax, partially oset by $15 million in pre-tax charges for certain
litigation contingencies. Furthermore, operating expenses in scal
2007 included an $11 million charge related to closing two Sam’s Clubs,
partially oset by the favorable impact of property insurance-related
gains of $6 million. In scal 2007, operating expenses as a percentage
of segment net sales increased compared to scal 2006 primarily due
to a slight increase in employee-related costs.
Membership and other income, which includes a variety of income
categories, increased in scal 2008 when compared to scal 2007.
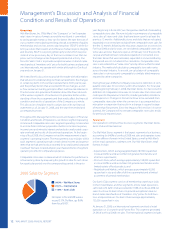
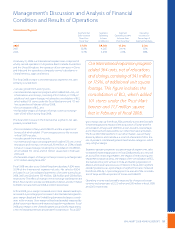
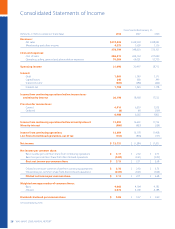
Sam’s Club Segment
Segment Net Segment Segment Operating
Sales Increase Operating Operating Income Income as a
from Prior Income Increase from Percentage of
Fiscal Year (in millions) Prior Fiscal Year Segment Net Sales
2008 6.7% $1,618 9.3% 3.6%
2007 4.5% $1,480 5.2% 3.6%
2006 7.2% $1,407 10.2% 3.5%
Sam’s Club total expansion program
added 2.0 million of additional
club square footage, or 2.6%, in
fiscal 2008.