ICICI Bank 2015 Annual Report Download - page 100
Download and view the complete annual report
Please find page 100 of the 2015 ICICI Bank annual report below. You can navigate through the pages in the report by either clicking on the pages listed below, or by using the keyword search tool below to find specific information within the annual report.-
 1
1 -
2
-
3
-
4
-
5
-
6
-
7
-
8
-
9
-
10
-
11
-
12
-
13
-
14
-
15
-
16
-
17
-
18
-
19
-
20
-
21
-
22
-
23
-
24
-
25
-
26
-
27
-
28
-
29
-
30
-
31
-
32
-
33
-
34
-
35
-
36
-
37
-
38
-
39
-
40
-
41
-
42
-
43
-
44
-
45
-
46
-
47
-
48
-
49
-
50
-
51
-
52
-
53
-
54
-
55
-
56
-
57
-
58
-
59
-
60
-
61
-
62
-
63
-
64
-
65
-
66
-
67
-
68
-
69
-
70
-
71
-
72
-
73
-
74
-
75
-
76
-
77
-
78
-
79
-
80
-
81
-
82
-
83
-
84
-
85
-
86
-
87
-
88
-
89
-
 90
90 -
 91
91 -
 92
92 -
 93
93 -
 94
94 -
 95
95 -
 96
96 -
 97
97 -
 98
98 -
 99
99 -
 100
100 -
 101
101 -
 102
102 -
 103
103 -
 104
104 -
 105
105 -
 106
106 -
 107
107 -
 108
108 -
 109
109 -
 110
110 -
111
-
112
-
113
-
114
-
115
-
116
-
117
-
118
-
119
-
120
-
121
-
122
-
123
-
124
-
125
-
126
-
127
-
128
-
129
-
130
-
131
-
132
-
133
-
134
-
135
-
136
-
137
-
138
-
139
-
140
-
141
-
142
-
143
-
144
-
145
-
146
-
147
-
148
-
149
-
150
-
151
-
152
-
153
-
154
-
155
-
156
-
157
-
158
-
159
-
160
-
161
-
162
-
163
-
164
-
165
-
166
-
167
-
168
-
169
-
170
-
171
-
172
-
173
-
174
-
175
-
176
-
177
-
178
-
179
-
180
-
181
-
182
-
183
-
184
-
185
-
186
-
187
-
188
-
189
-
190
-
191
-
192
-
193
-
194
-
195
-
196
-
197
-
198
-
199
-
200
-
201
-
202
-
203
-
204
-
205
-
206
-
207
-
208
-
209
-
210
-
211
-
212
-
213
-
214
-
215
-
216
-
217
-
218
-
219
-
220
-
221
-
222
-
223
-
224
-
225
-
226
-
227
-
228
-
229
-
230
-
231
-
232
-
233
-
234
-
235
-
236
 |
 |

Management’s Discussion & Analysis
98 Annual Report 2014-2015
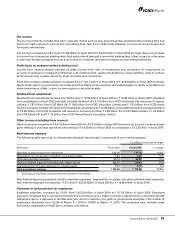
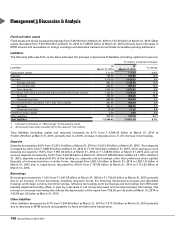
Depreciation
Depreciation on owned property increased by 14.7% from ` 5.44 billion in fiscal 2014 to ` 6.24 billion in fiscal 2015 due to
an increase in fixed assets with higher depreciation rates. Depreciation on leased assets increased from ` 0.32 billion in
fiscal 2014 to ` 0.35 billion in fiscal 2015.
Other administrative expenses
Other administrative expenses primarily include rent, taxes and lighting, advertisement and publicity, repairs and
maintenance and direct marketing expenses. Other administrative expenses increased by 10.4% from ` 55.13 billion in
fiscal 2014 to ` 60.87 billion in fiscal 2015. The increase in other administrative expenses was primarily due to an increase
in the Bank’s branch and ATM network and retail business volumes. The number of branches in India increased from 3,753
at March 31, 2014 to 4,050 at March 31, 2015. The ATM network of the Bank increased from 11,315 ATMs at March 31, 2014
to 12,451 ATMs at March 31, 2015.
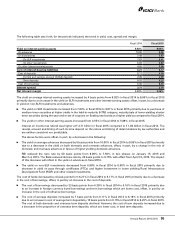
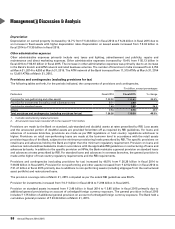
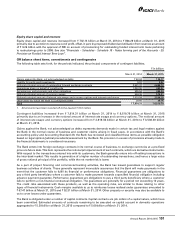
Provisions and contingencies (excluding provisions for tax)
The following tables set forth, for the periods indicated, the components of provisions and contingencies.
` in billion, except percentages
Particulars Fiscal 2014 Fiscal 2015 % change
Provision for non-performing and other assets1` 22.52 ` 31.41 39.5%
Provision for investments (including credit substitutes) (net) 0.71 2.98 –
Provision for standard assets 2.49 3.85 54.6
Others 0.54 0.76 40.7
Total provisions and contingencies (excluding provisions for tax) ` 26.26 ` 39.00 48.5%
1. Includes restructuring related provision.
2. All amounts have been rounded off to the nearest ` 10.0 million.
Provisions are made by the Bank on standard, sub-standard and doubtful assets at rates prescribed by RBI. Loss assets
and the unsecured portion of doubtful assets are provided for/written off as required by RBI guidelines. For loans and
advances of overseas branches, provisions are made as per RBI regulations or host country regulations whichever is
higher. Provisions on retail non-performing loans are made at the borrower level in accordance with the retail assets
provisioning policy of the Bank, subject to the minimum provisioning levels prescribed by RBI. The specific provisions on
retail loans and advances held by the Bank are higher than the minimum regulatory requirement. Provision on loans and
advances restructured/rescheduled is made in accordance with the applicable RBI guidelines on restructuring of loans and
advances by banks. In addition to the specific provision on NPAs, the Bank maintains a general provision on standard loans
and advances at rates prescribed by RBI. For standard loans and advances in overseas branches, the general provision is
made at the higher of host country regulatory requirements and the RBI requirements.
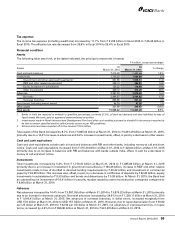
Provisions and contingencies (excluding provisions for tax) increased by 48.5% from ` 26.26 billion in fiscal 2014 to
` 39.00 billion in fiscal 2015. Provision for non-performing and other assets increased from ` 22.52 billion in fiscal 2014 to
` 31.41 billion in fiscal 2015 primarily due to additions to non-performing assets (including slippages from the restructured
asset portfolio) and restructured loans.
The provision coverage ratio at March 31, 2015 computed as per the extant RBI guidelines was 58.6%.
Provision for investments increased from ` 0.71 billion in fiscal 2014 to ` 2.98 billion in fiscal 2015.
Provision on standard assets increased from ` 2.49 billion in fiscal 2014 to ` 3.85 billion in fiscal 2015 primarily due to
additional general provisioning on account of unhedged foreign currency exposure. The general provision in fiscal 2015
includes ` 1.75 billion of additional general provision on account of unhedged foreign currency exposure. The Bank held a
cumulative general provision of ` 23.34 billion at March 31, 2015.