ICICI Bank 2015 Annual Report Download - page 104
Download and view the complete annual report
Please find page 104 of the 2015 ICICI Bank annual report below. You can navigate through the pages in the report by either clicking on the pages listed below, or by using the keyword search tool below to find specific information within the annual report.-
 1
1 -
2
-
3
-
4
-
5
-
6
-
7
-
8
-
9
-
10
-
11
-
12
-
13
-
14
-
15
-
16
-
17
-
18
-
19
-
20
-
21
-
22
-
23
-
24
-
25
-
26
-
27
-
28
-
29
-
30
-
31
-
32
-
33
-
34
-
35
-
36
-
37
-
38
-
39
-
40
-
41
-
42
-
43
-
44
-
45
-
46
-
47
-
48
-
49
-
50
-
51
-
52
-
53
-
54
-
55
-
56
-
57
-
58
-
59
-
60
-
61
-
62
-
63
-
64
-
65
-
66
-
67
-
68
-
69
-
70
-
71
-
72
-
73
-
74
-
75
-
76
-
77
-
78
-
79
-
80
-
81
-
82
-
83
-
84
-
85
-
86
-
87
-
88
-
89
-
90
-
91
-
92
-
93
-
 94
94 -
 95
95 -
 96
96 -
 97
97 -
 98
98 -
 99
99 -
 100
100 -
 101
101 -
 102
102 -
 103
103 -
 104
104 -
 105
105 -
 106
106 -
 107
107 -
 108
108 -
 109
109 -
 110
110 -
 111
111 -
 112
112 -
 113
113 -
 114
114 -
115
-
116
-
117
-
118
-
119
-
120
-
121
-
122
-
123
-
124
-
125
-
126
-
127
-
128
-
129
-
130
-
131
-
132
-
133
-
134
-
135
-
136
-
137
-
138
-
139
-
140
-
141
-
142
-
143
-
144
-
145
-
146
-
147
-
148
-
149
-
150
-
151
-
152
-
153
-
154
-
155
-
156
-
157
-
158
-
159
-
160
-
161
-
162
-
163
-
164
-
165
-
166
-
167
-
168
-
169
-
170
-
171
-
172
-
173
-
174
-
175
-
176
-
177
-
178
-
179
-
180
-
181
-
182
-
183
-
184
-
185
-
186
-
187
-
188
-
189
-
190
-
191
-
192
-
193
-
194
-
195
-
196
-
197
-
198
-
199
-
200
-
201
-
202
-
203
-
204
-
205
-
206
-
207
-
208
-
209
-
210
-
211
-
212
-
213
-
214
-
215
-
216
-
217
-
218
-
219
-
220
-
221
-
222
-
223
-
224
-
225
-
226
-
227
-
228
-
229
-
230
-
231
-
232
-
233
-
234
-
235
-
236
 |
 |

Management’s Discussion & Analysis
102 Annual Report 2014-2015
Capital resources
The Bank actively manages its capital to meet regulatory norms and current and future business needs considering the
risks in its businesses, expectations of rating agencies, shareholders and investors and the available options for raising
capital. The capital management framework of the Bank is administered by the Finance Group and the Risk Management
Group under the supervision of the Board and the Risk Committee. The capital adequacy position and assessment is
reported to the Board and the Risk Committee periodically.
Regulatory capital
The Bank is subject to Basel III guidelines issued by RBI, effective from April 1, 2013, which is implemented in a phased
manner through till March 31, 2019 as per the transitional arrangement provided by RBI for Basel III implementation. The
Basel III rules on capital consist of measures on improving the quality, consistency and transparency of capital, enhancing
risk coverage, introducing a supplementary leverage ratio, reducing pro-cyclicality and promoting counter-cyclical buffers
and addressing systemic risk and inter-connectedness.
At March 31, 2015, the Bank is required to maintain minimum Common Equity Tier-1 (CET1) capital ratio of 5.50%, minimum
Tier-1 capital ratio of 7.00% and minimum total capital ratio of 9.00%. Under Pillar 1 of RBI guidelines on Basel III, the Bank
follows the standardised approach for measurement of credit risk, standardised duration method for measurement of
market risk and basic indicator approach for measurement of operational risk.
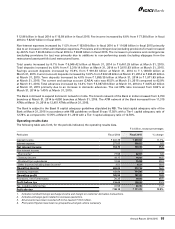
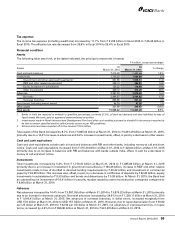
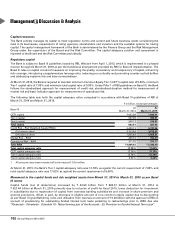
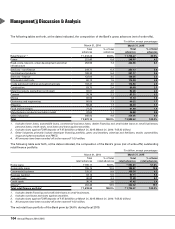
The following table sets forth the capital adequacy ratios computed in accordance with Basel III guidelines of RBI at
March 31, 2014 and March 31, 2015.
` in billion, except percentages
Basel III At
March 31, 2014
At
March 31, 2015
CET1 capital ` 637.38 ` 696.61
Tier-1 capital 637.38 696.61
Tier-2 capital 245.13 230.83
Total capital 882.51 927.44
Credit Risk – Risk Weighted Assets (RWA) 4,409.13 4,741.56
On balance sheet 3,353.64 3,678.25
Off balance sheet 1,055.49 1,063.31
Market Risk – RWA 265.74 334.23
Operational Risk – RWA 311.16 373.17
Total RWA ` 4,986.03 ` 5,448.96
Total capital adequacy ratio 17.70% 17.02%
CET1 capital adequacy ratio 12.78% 12.78%
Tier-1 capital adequacy ratio 12.78% 12.78%
Tier-2 capital adequacy ratio 4.92% 4.24%
1. All amounts have been rounded off to the nearest ` 10.0 million.
At March 31, 2015, the Bank’s Tier-1 capital adequacy ratio was 12.78% as against the current requirement of 7.00% and
total capital adequacy ratio was 17.02% as against the current requirement of 9.00%.
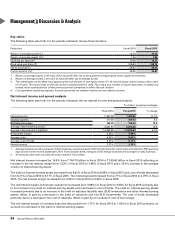
Movement in the capital funds and risk weighted assets from March 31, 2014 to March 31, 2015 as per Basel
III norms
Capital funds (net of deductions) increased by ` 44.93 billion from ` 882.51 billion at March 31, 2014 to
` 927.44 billion at March 31, 2015 primarily due to inclusion of profit for fiscal 2015, lower deduction for investment
in subsidiaries due to repatriation of capital from overseas banking subsidiaries and increase in share premium and
general provisions, offset, in part, by decrease in eligible amount of non-common equity capital due to discounting
as per Basel III grandfathering rules and utilisation from reserves an amount of ` 9.29 billion with the approval of RBI on
account of provisioning for outstanding funded interest term loans pertaining to restructurings prior to 2008. See also
“Financials – Schedules - Schedule 18 - Notes forming part of the Accounts - 25. Provision on Funded Interest Term Loan”.