ICICI Bank 2015 Annual Report Download - page 138
Download and view the complete annual report
Please find page 138 of the 2015 ICICI Bank annual report below. You can navigate through the pages in the report by either clicking on the pages listed below, or by using the keyword search tool below to find specific information within the annual report.-
 1
1 -
2
-
3
-
4
-
5
-
6
-
7
-
8
-
9
-
10
-
11
-
12
-
13
-
14
-
15
-
16
-
17
-
18
-
19
-
20
-
21
-
22
-
23
-
24
-
25
-
26
-
27
-
28
-
29
-
30
-
31
-
32
-
33
-
34
-
35
-
36
-
37
-
38
-
39
-
40
-
41
-
42
-
43
-
44
-
45
-
46
-
47
-
48
-
49
-
50
-
51
-
52
-
53
-
54
-
55
-
56
-
57
-
58
-
59
-
60
-
61
-
62
-
63
-
64
-
65
-
66
-
67
-
68
-
69
-
70
-
71
-
72
-
73
-
74
-
75
-
76
-
77
-
78
-
79
-
80
-
81
-
82
-
83
-
84
-
85
-
86
-
87
-
88
-
89
-
90
-
91
-
92
-
93
-
94
-
95
-
96
-
97
-
98
-
99
-
100
-
101
-
102
-
103
-
104
-
105
-
106
-
107
-
108
-
109
-
110
-
111
-
112
-
113
-
114
-
115
-
116
-
117
-
118
-
119
-
120
-
121
-
122
-
123
-
124
-
125
-
126
-
127
-
 128
128 -
 129
129 -
 130
130 -
 131
131 -
 132
132 -
 133
133 -
 134
134 -
 135
135 -
 136
136 -
 137
137 -
 138
138 -
 139
139 -
 140
140 -
 141
141 -
 142
142 -
 143
143 -
 144
144 -
 145
145 -
 146
146 -
 147
147 -
 148
148 -
149
-
150
-
151
-
152
-
153
-
154
-
155
-
156
-
157
-
158
-
159
-
160
-
161
-
162
-
163
-
164
-
165
-
166
-
167
-
168
-
169
-
170
-
171
-
172
-
173
-
174
-
175
-
176
-
177
-
178
-
179
-
180
-
181
-
182
-
183
-
184
-
185
-
186
-
187
-
188
-
189
-
190
-
191
-
192
-
193
-
194
-
195
-
196
-
197
-
198
-
199
-
200
-
201
-
202
-
203
-
204
-
205
-
206
-
207
-
208
-
209
-
210
-
211
-
212
-
213
-
214
-
215
-
216
-
217
-
218
-
219
-
220
-
221
-
222
-
223
-
224
-
225
-
226
-
227
-
228
-
229
-
230
-
231
-
232
-
233
-
234
-
235
-
236
 |
 |

136 Annual Report 2014-2015
Schedules
forming part of the Accounts (Contd.)
Financial Statements of ICICI Bank Limited
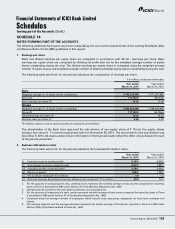
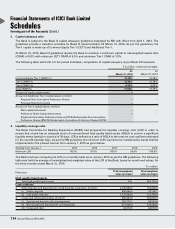
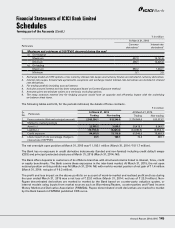
Based on the above, monthly average LCR of the Bank for the three months ended March 31, 2015 was 101.45%. It
may be noted that during the three months ended on March 31, 2015, other than Indian Rupee, USD was the only
significant foreign currency which constituted more than 5.00% of the balance sheet size of the Bank. Average LCR of
the Bank for USD currency was 100.83% for the three months ended March 31, 2015.
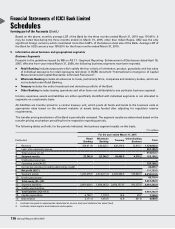
5. Information about business and geographical segments
Business Segments
Pursuant to the guidelines issued by RBI on AS 17 - Segment Reporting- Enhancement of Disclosures dated April 18,
2007, effective from year ended March 31, 2008, the following business segments have been reported.
Retail Banking includes exposures which satisfy the four criteria of orientation, product, granularity and low value
of individual exposures for retail exposures laid down in BCBS document “International Convergence of Capital
Measurement and Capital Standards: A Revised Framework”.
Wholesale Banking includes all advances to trusts, partnership firms, companies and statutory bodies, which are
not included under Retail Banking.
Treasury includes the entire investment and derivative portfolio of the Bank.
Other Banking includes leasing operations and other items not attributable to any particular business segment.
Income, expenses, assets and liabilities are either specifically identified with individual segments or are allocated to
segments on a systematic basis.
All liabilities are transfer priced to a central treasury unit, which pools all funds and lends to the business units at
appropriate rates based on the relevant maturity of assets being funded after adjusting for regulatory reserve
requirements.
The transfer pricing mechanism of the Bank is periodically reviewed. The segment results are determined based on the
transfer pricing mechanism prevailing for the respective reporting periods.
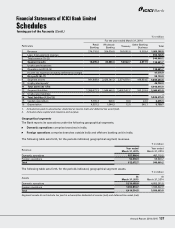
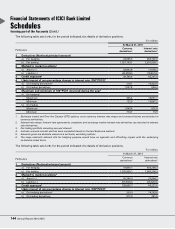
The following tables set forth, for the periods indicated, the business segment results on this basis.
` in million
For the year ended March 31, 2015
Particulars Retail
Banking
Wholesale
Banking Treasury Other Banking
Business Total
1 Revenue 329,911.8 335,025.1 439,310.6 15,815.1 1,120,062.6
2 Less: Inter-segment revenue 507,389.9
3 Total revenue (1)–(2) 612,672.7
4 Segment results 27,242.8 62,240.7 64,499.5 4,216.2 158,199.2
5 Unallocated expenses –
6 Operating profit (4)-(5) 158,199.2
7Income tax expenses (including deferred tax credit) 46,445.7
8 Net profit (6)-(7) 111,753.5
9 Segment assets 1,297,275.5 2,612,211.8 2,379,339.6 125,687.6 6,414,514.5
10 Unallocated assets146,778.4
11 Total assets (9)+(10) 6,461,292.9
12 Segment liabilities 2,661,620.1 1,038,243.2 2,656,157.02105,272.6 6,461,292.9
13 Unallocated liabilities –
14 Total liabilities (12)+(13) 6,461,292.9
15 Capital expenditure 6,109.1 1,110.3 16.4 33.7 7,269.5
16 Depreciation 5,111.4 1,073.5 12.8 391.8 6,589.5
1. Includes tax paid in advance/tax deducted at source (net) and deferred tax asset (net).
2. Includes share capital and reserves and surplus.