ICICI Bank 2015 Annual Report Download - page 99
Download and view the complete annual report
Please find page 99 of the 2015 ICICI Bank annual report below. You can navigate through the pages in the report by either clicking on the pages listed below, or by using the keyword search tool below to find specific information within the annual report.-
 1
1 -
2
-
3
-
4
-
5
-
6
-
7
-
8
-
9
-
10
-
11
-
12
-
13
-
14
-
15
-
16
-
17
-
18
-
19
-
20
-
21
-
22
-
23
-
24
-
25
-
26
-
27
-
28
-
29
-
30
-
31
-
32
-
33
-
34
-
35
-
36
-
37
-
38
-
39
-
40
-
41
-
42
-
43
-
44
-
45
-
46
-
47
-
48
-
49
-
50
-
51
-
52
-
53
-
54
-
55
-
56
-
57
-
58
-
59
-
60
-
61
-
62
-
63
-
64
-
65
-
66
-
67
-
68
-
69
-
70
-
71
-
72
-
73
-
74
-
75
-
76
-
77
-
78
-
79
-
80
-
81
-
82
-
83
-
84
-
85
-
86
-
87
-
88
-
 89
89 -
 90
90 -
 91
91 -
 92
92 -
 93
93 -
 94
94 -
 95
95 -
 96
96 -
 97
97 -
 98
98 -
 99
99 -
 100
100 -
 101
101 -
 102
102 -
 103
103 -
 104
104 -
 105
105 -
 106
106 -
 107
107 -
 108
108 -
 109
109 -
110
-
111
-
112
-
113
-
114
-
115
-
116
-
117
-
118
-
119
-
120
-
121
-
122
-
123
-
124
-
125
-
126
-
127
-
128
-
129
-
130
-
131
-
132
-
133
-
134
-
135
-
136
-
137
-
138
-
139
-
140
-
141
-
142
-
143
-
144
-
145
-
146
-
147
-
148
-
149
-
150
-
151
-
152
-
153
-
154
-
155
-
156
-
157
-
158
-
159
-
160
-
161
-
162
-
163
-
164
-
165
-
166
-
167
-
168
-
169
-
170
-
171
-
172
-
173
-
174
-
175
-
176
-
177
-
178
-
179
-
180
-
181
-
182
-
183
-
184
-
185
-
186
-
187
-
188
-
189
-
190
-
191
-
192
-
193
-
194
-
195
-
196
-
197
-
198
-
199
-
200
-
201
-
202
-
203
-
204
-
205
-
206
-
207
-
208
-
209
-
210
-
211
-
212
-
213
-
214
-
215
-
216
-
217
-
218
-
219
-
220
-
221
-
222
-
223
-
224
-
225
-
226
-
227
-
228
-
229
-
230
-
231
-
232
-
233
-
234
-
235
-
236
 |
 |

97Annual Report 2014-2015
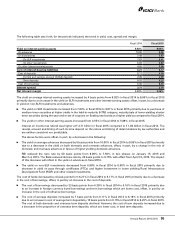
Fee income
Fee income primarily includes fees from corporate clients such as loan processing fees and transaction banking fees and
fees from retail customers such as loan processing fees, fees from credit cards business, account servicing charges and
third party referral fees.
Fee income increased by 6.8% from ` 77.58 billion in fiscal 2014 to ` 82.87 billion in fiscal 2015 primarily due to an increase
in income from transaction banking fees, third party referral fees and commercial banking fees, offset, in part by a decrease
in merchant foreign exchange income and income on customer derivative transactions and lending linked fees.
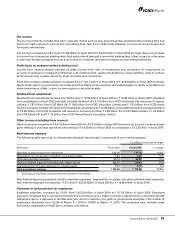
Prot/(loss) on treasury-related activities (net)
Income from treasury-related activities includes income from sale of investments and revaluation of investments on
account of changes in unrealised profit/(loss) in the fixed income, equity and preference share portfolio, units of venture
funds and security receipts issued by asset reconstruction companies.
Profit from treasury-related activities increased from ` 10.17 billion in fiscal 2014 to ` 16.93 billion in fiscal 2015 primarily
due to higher gains on government securities and other fixed income positions and realised gains on equity and preference
share investments, offset, in part, by lower gains on security receipts.
Dividend from subsidiaries
Dividend from subsidiaries increased by 20.3% from ` 12.96 billion in fiscal 2014 to ` 15.59 billion in fiscal 2015. Dividend
from subsidiaries in fiscal 2015 primarily included dividend of ` 6.17 billion from ICICI Prudential Life Insurance Company
Limited, ` 1.87 billion from ICICI Bank UK, ` 1.86 billion from ICICI Securities Limited and ` 1.61 billion from ICICI Home
Finance Company Limited. Dividend from subsidiaries amounting to ` 12.96 billion in fiscal 2014 primarily included dividend
of ` 6.90 billion from ICICI Prudential Life Insurance Company Limited, ` 2.86 billion from ICICI Bank Canada, ` 1.54 billion
from ICICI Bank UK and ` 1.14 billion from ICICI Home Finance Company Limited.
Other income (including lease income)
Other income increased from ` 3.57 billion in fiscal 2014 to ` 6.37 billion in fiscal 2015 primarily on account of net exchange
gains relating to overseas operations amounting to ` 6.42 billion in fiscal 2015 as compared to ` 2.22 billion in fiscal 2014.
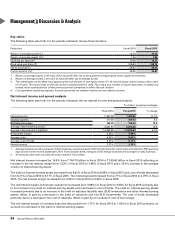
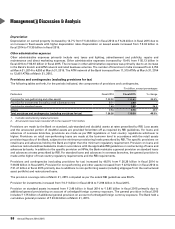
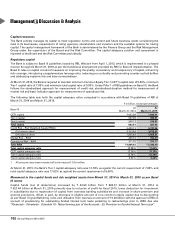
Non-interest expense
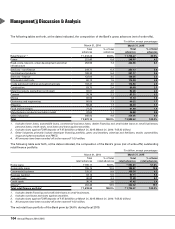
The following table sets forth, for the periods indicated, the principal components of non-interest expense.
` in billion, except percentages
Particulars Fiscal 2014 Fiscal 2015 % change
Payments to and provisions for employees ` 42.20 ` 47.50 12.6%
Depreciation on own property (including non-banking assets) 5.44 6.24 14.7
Other administrative expenses 55.13 60.87 10.4
Total non-interest expense (excluding lease depreciation) 102.77 114.61 11.5
Depreciation (net of lease equalisation) on leased assets 0.32 0.35 9.4
Total non-interest expense ` 103.09 ` 114.96 11.5%
1. All amounts have been rounded off to the nearest ` 10.0 million.
Non-interest expenses primarily include employee expenses, depreciation on assets and other administrative expenses.
Non-interest expenses increased by 11.5% from ` 103.09 billion in fiscal 2014 to ` 114.96 billion in fiscal 2015.
Payments to and provisions for employees
Employee expenses increased by 12.6% from ` 42.20 billion in fiscal 2014 to ` 47.50 billion in fiscal 2015. Employee
expenses increased due to annual increments and promotions and a higher provision requirement for retirement benefit
obligations due to a decrease in the discount rate, which is linked to the yield on government securities. The number of
employees decreased from 72,226 at March 31, 2014 to 67,857 at March 31, 2015. The employee base includes sales
executives, employees on fixed term contracts and interns.