ICICI Bank 2015 Annual Report Download - page 142
Download and view the complete annual report
Please find page 142 of the 2015 ICICI Bank annual report below. You can navigate through the pages in the report by either clicking on the pages listed below, or by using the keyword search tool below to find specific information within the annual report.-
 1
1 -
2
-
3
-
4
-
5
-
6
-
7
-
8
-
9
-
10
-
11
-
12
-
13
-
14
-
15
-
16
-
17
-
18
-
19
-
20
-
21
-
22
-
23
-
24
-
25
-
26
-
27
-
28
-
29
-
30
-
31
-
32
-
33
-
34
-
35
-
36
-
37
-
38
-
39
-
40
-
41
-
42
-
43
-
44
-
45
-
46
-
47
-
48
-
49
-
50
-
51
-
52
-
53
-
54
-
55
-
56
-
57
-
58
-
59
-
60
-
61
-
62
-
63
-
64
-
65
-
66
-
67
-
68
-
69
-
70
-
71
-
72
-
73
-
74
-
75
-
76
-
77
-
78
-
79
-
80
-
81
-
82
-
83
-
84
-
85
-
86
-
87
-
88
-
89
-
90
-
91
-
92
-
93
-
94
-
95
-
96
-
97
-
98
-
99
-
100
-
101
-
102
-
103
-
104
-
105
-
106
-
107
-
108
-
109
-
110
-
111
-
112
-
113
-
114
-
115
-
116
-
117
-
118
-
119
-
120
-
121
-
122
-
123
-
124
-
125
-
126
-
127
-
128
-
129
-
130
-
131
-
 132
132 -
 133
133 -
 134
134 -
 135
135 -
 136
136 -
 137
137 -
 138
138 -
 139
139 -
 140
140 -
 141
141 -
 142
142 -
 143
143 -
 144
144 -
 145
145 -
 146
146 -
 147
147 -
 148
148 -
 149
149 -
 150
150 -
 151
151 -
 152
152 -
153
-
154
-
155
-
156
-
157
-
158
-
159
-
160
-
161
-
162
-
163
-
164
-
165
-
166
-
167
-
168
-
169
-
170
-
171
-
172
-
173
-
174
-
175
-
176
-
177
-
178
-
179
-
180
-
181
-
182
-
183
-
184
-
185
-
186
-
187
-
188
-
189
-
190
-
191
-
192
-
193
-
194
-
195
-
196
-
197
-
198
-
199
-
200
-
201
-
202
-
203
-
204
-
205
-
206
-
207
-
208
-
209
-
210
-
211
-
212
-
213
-
214
-
215
-
216
-
217
-
218
-
219
-
220
-
221
-
222
-
223
-
224
-
225
-
226
-
227
-
228
-
229
-
230
-
231
-
232
-
233
-
234
-
235
-
236
 |
 |

140 Annual Report 2014-2015
Schedules
forming part of the Accounts (Contd.)
Financial Statements of ICICI Bank Limited
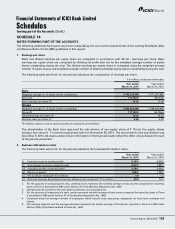
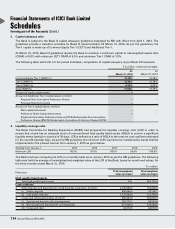
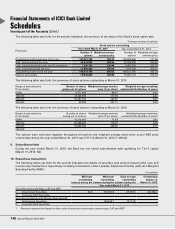
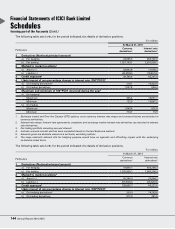
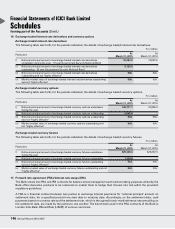
The following table sets forth, for the periods indicated, the summary of the status of the Bank’s stock option plan.
` except number of options
Particulars
Stock options outstanding
Year ended March 31, 2015 Year ended March 31, 2014
Number of
options
Weighted average
exercise price
Number of
options
Weighted average
exercise price
Outstanding at the beginning of the year 140,521,765 183.74 129,902,265 171.04
Add: Granted during the year 32,375,500 259.96 22,098,250 235.43
Less: Lapsed during the year, net of re-issuance 1,382,765 235.40 4,451,050 192.33
Less: Exercised during the year 23,080,800 150.66 7,027,700 106.11
Outstanding at the end of the year 148,433,700 205.02 140,521,765 183.74
Options exercisable 75,938,800 180.80 73,041,715 166.70
The following table sets forth, the summary of stock options outstanding at March 31, 2015.
Range of exercise price
(` per share)
Number of shares
arising out of options
Weighted average exercise
price (` per share)
Weighted average remaining
contractual life (Number of years)
60-99 4,771,000 80.81 2.41
100-199 74,346,685 177.35 4.41
200-299 69,291,015 243.22 8.06
300-399 25,000 321.17 9.59
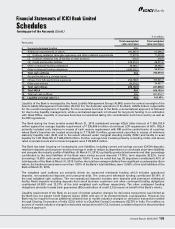
The following table sets forth, the summary of stock options outstanding at March 31, 2014.
Range of exercise price
(` per share)
Number of shares
arising out of options
Weighted average exercise
price (` per share)
Weighted average remaining
contractual life (Number of years)
60-99 10,216,665 77.64 2.81
100-199 90,398,800 175.81 5.26
200-299 39,906,300 228.84 8.15
300-399 – – –
The options were exercised regularly throughout the period and weighted average share price as per NSE price
volume data during the year ended March 31, 2015 was ` 311.74 (March 31, 2014: ` 209.32)
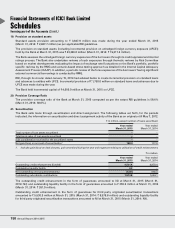
9. Subordinated debt
During the year ended March 31, 2015, the Bank has not raised subordinated debt qualifying for Tier-2 capital
(March 31, 2014: Nil).
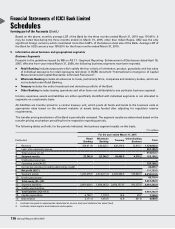
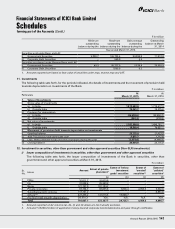
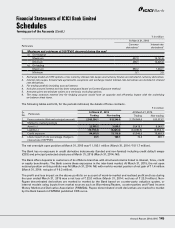
10. Repurchase transactions
The following tables set forth for the periods indicated, the details of securities sold and purchased under repo and
reverse repo transactions respectively including transactions under Liquidity Adjustment Facility (LAF) and Marginal
Standing Facility (MSF).
` in million
Minimum
outstanding
balance during the
Maximum
outstanding
balance during the
Daily average
outstanding
balance during the
Outstanding
balance at
March 31, 2015
Year ended March 31, 2015
Securities sold under Repo, LAF and MSF
i) Government Securities 54.0 153,941.9 66,700.1 128,782.2
ii) Corporate Debt Securities – – – –
Securities purchased under Reverse Repo and LAF
i) Government Securities – 105,439.7 10,113.8 –
ii) Corporate Debt Securities – – – –
1. Amounts reported are based on face value of securities under repo, reverse repo, LAF and MSF.