ICICI Bank 2015 Annual Report Download - page 97
Download and view the complete annual report
Please find page 97 of the 2015 ICICI Bank annual report below. You can navigate through the pages in the report by either clicking on the pages listed below, or by using the keyword search tool below to find specific information within the annual report.-
 1
1 -
2
-
3
-
4
-
5
-
6
-
7
-
8
-
9
-
10
-
11
-
12
-
13
-
14
-
15
-
16
-
17
-
18
-
19
-
20
-
21
-
22
-
23
-
24
-
25
-
26
-
27
-
28
-
29
-
30
-
31
-
32
-
33
-
34
-
35
-
36
-
37
-
38
-
39
-
40
-
41
-
42
-
43
-
44
-
45
-
46
-
47
-
48
-
49
-
50
-
51
-
52
-
53
-
54
-
55
-
56
-
57
-
58
-
59
-
60
-
61
-
62
-
63
-
64
-
65
-
66
-
67
-
68
-
69
-
70
-
71
-
72
-
73
-
74
-
75
-
76
-
77
-
78
-
79
-
80
-
81
-
82
-
83
-
84
-
85
-
86
-
 87
87 -
 88
88 -
 89
89 -
 90
90 -
 91
91 -
 92
92 -
 93
93 -
 94
94 -
 95
95 -
 96
96 -
 97
97 -
 98
98 -
 99
99 -
 100
100 -
 101
101 -
 102
102 -
 103
103 -
 104
104 -
 105
105 -
 106
106 -
 107
107 -
108
-
109
-
110
-
111
-
112
-
113
-
114
-
115
-
116
-
117
-
118
-
119
-
120
-
121
-
122
-
123
-
124
-
125
-
126
-
127
-
128
-
129
-
130
-
131
-
132
-
133
-
134
-
135
-
136
-
137
-
138
-
139
-
140
-
141
-
142
-
143
-
144
-
145
-
146
-
147
-
148
-
149
-
150
-
151
-
152
-
153
-
154
-
155
-
156
-
157
-
158
-
159
-
160
-
161
-
162
-
163
-
164
-
165
-
166
-
167
-
168
-
169
-
170
-
171
-
172
-
173
-
174
-
175
-
176
-
177
-
178
-
179
-
180
-
181
-
182
-
183
-
184
-
185
-
186
-
187
-
188
-
189
-
190
-
191
-
192
-
193
-
194
-
195
-
196
-
197
-
198
-
199
-
200
-
201
-
202
-
203
-
204
-
205
-
206
-
207
-
208
-
209
-
210
-
211
-
212
-
213
-
214
-
215
-
216
-
217
-
218
-
219
-
220
-
221
-
222
-
223
-
224
-
225
-
226
-
227
-
228
-
229
-
230
-
231
-
232
-
233
-
234
-
235
-
236
 |
 |
95Annual Report 2014-2015
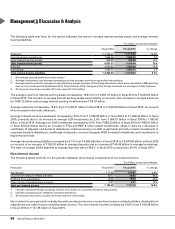
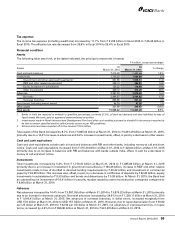
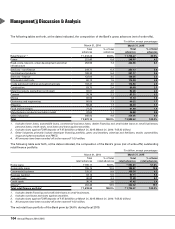
The following table sets forth, for the periods indicated, the trend in yield, cost, spread and margin.
Fiscal 2014 Fiscal 2015
Yield on interest-earning assets 8.92% 8.96%
- On advances 10.00 9.95
- On investments 7.48 7.47
- On SLR investments 7.83 8.01
- On other investments 6.89 6.60
- On other interest-earning assets 4.55 5.08
Cost of interest-bearing liabilities 6.21 6.17
- Cost of deposits 6.11 6.18
- Current and savings account (CASA) deposits 2.99 3.00
- Term deposits 8.15 8.25
- Cost of borrowings 6.39 6.16
Interest spread 2.71 2.79
Net interest margin 3.33% 3.48%
The yield on average interest-earning assets increased by 4 basis points from 8.92% in fiscal 2014 to 8.96% in fiscal 2015
primarily due to an increase in the yield on SLR investments and other interest-earning assets offset, in part, by a decrease
in yield on non-SLR investments and advances.
The yield on SLR investments increased from 7.83% in fiscal 2014 to 8.01% in fiscal 2015 primarily due to purchase of
medium tenor securities at higher yields in the held-to-maturity (HTM) category, maturity/sale of lower-yielding shorter
tenor securities during the year and re-set of coupons on floating rate bonds at a higher yield as compared to fiscal 2014.
The yield on other interest-earning assets increased from 4.55% in fiscal 2014 to 5.08% in fiscal 2015.
Interest on income tax refund was higher at ` 2.71 billion in fiscal 2015 compared to ` 1.82 billion in fiscal 2014. The
receipt, amount and timing of such income depend on the nature and timing of determinations by tax authorities and
are neither consistent nor predictable.
The above factors were offset, in part, by a decrease in the following:
The yield on average advances decreased by 5 basis points from 10.00% in fiscal 2014 to 9.95% in fiscal 2015 primarily
due to a decrease in the yield on both domestic and overseas advances, offset, in part, by a change in the mix of
domestic and overseas advances in favour of higher yielding domestic advances.
RBI reduced the repo rate by 50 basis points from 8.00% to 7.50% in two phases on January 15, 2015 and
March 4, 2015. The Bank reduced its base rate by 25 basis points to 9.75% with effect from April 10, 2015. The impact
of this decrease will reflect in the yield on advances in fiscal 2016.
The yield on non-SLR investments decreased from 6.89% in fiscal 2014 to 6.60% in fiscal 2015 primarily due to
decrease in yield on pass through certificates (PTCs) and higher investment in lower yielding Rural Infrastructure
Development Fund (RIDF) and other related investments.
The cost of funds decreased by 4 basis points from 6.21% in fiscal 2014 to 6.17% in fiscal 2015 primarily due to a decrease
in the cost of borrowings, offset, in part by an increase in the cost of deposits.
The cost of borrowings decreased by 23 basis points from 6.39% in fiscal 2014 to 6.16% in fiscal 2015 primarily due
to an increase in foreign currency bond borrowings and term borrowings which are lower cost, offset, in part by an
increase in the cost of refinance borrowings.
The cost of average deposits increased by 7 basis points from 6.11% in fiscal 2014 to 6.18% in fiscal 2015 primarily
due to an increase in cost of average term deposits by 10 basis points from 8.15% in fiscal 2014 to 8.25% in fiscal 2015.
The cost of both domestic and overseas term deposits declined. However, the cost of term deposits increased due to
a decrease in the proportion of overseas term deposits, which are lower cost, in total term deposits.